SQL CLR CLR Debugging
SQL Server provides support for debugging CLR objects in the database. Debugging in SQL Server follows a per-connection model. A debugger can detect and debug activities only to the client connection to which it is attached.
- Users can step seamlessly into CLR objects from Transact-SQL, and vice versa.
- You can debug the CLR objects by using the debuggers in Visual Studio.
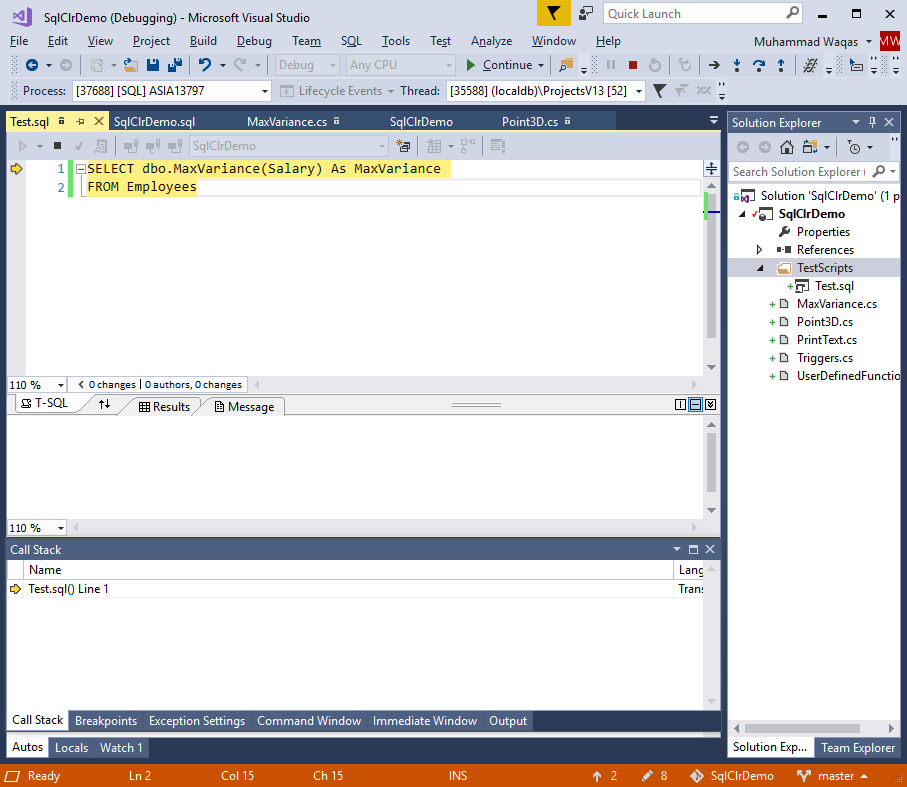
To debug CLR objects in Visual Studio, let's add TestScripts folder and then add Test.sql which is going to be the default test script source file.
SELECT dbo.MaxVariance(Salary) As MaxVariance
FROM Employees
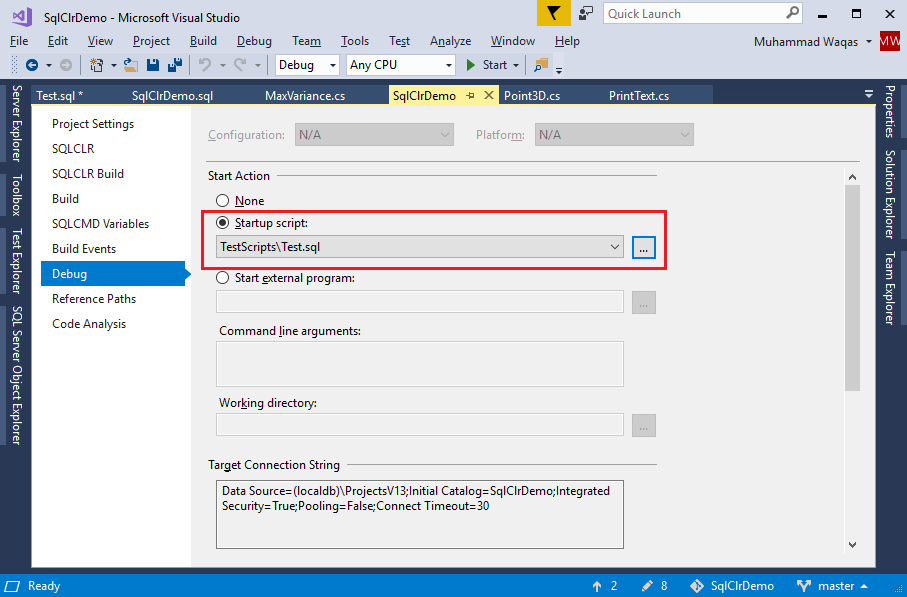
Add the test script that you want to debug. To make this script a default one, let's go to the project properties.

On the Debug page, choose the Startup Scrip and browse to the Test.sql file. In the Debug menu, select Start Debugging to compile, and test the project.
The test script in Test.sql will be invoked.

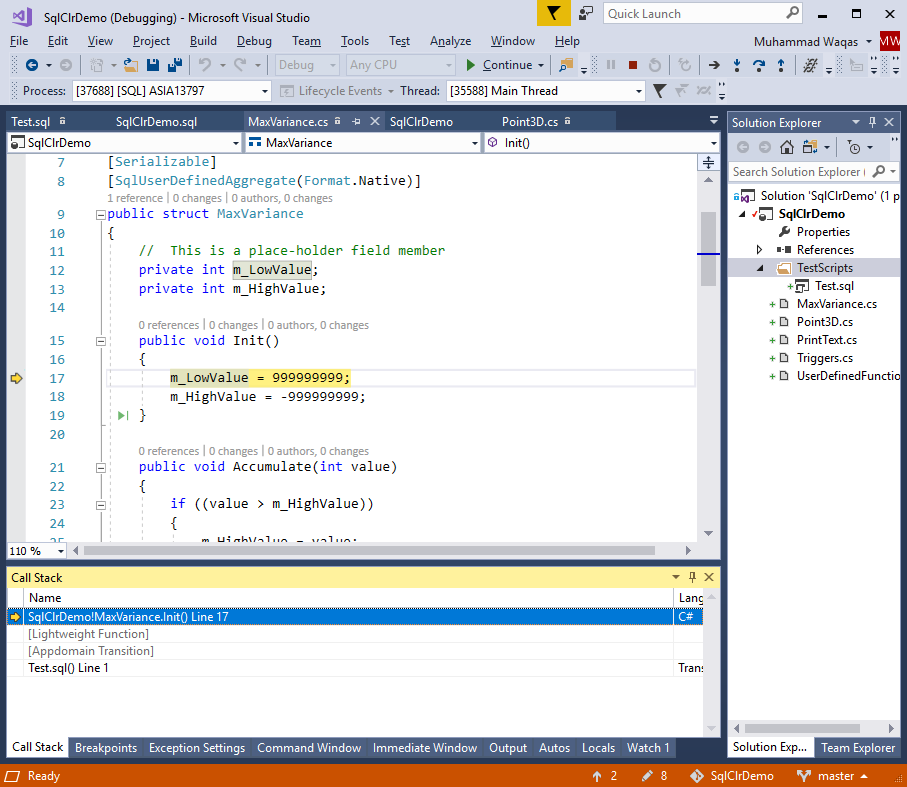
Now press F10 button and it will call the Init method.

Note
- Managed database object debugging in Visual Studio supports all common debugging features, such as "step into" and "step over" statements within routines executing on the server.
- Debuggers can set breakpoints, inspect the call stack, inspect variables, and modify variable values while debugging.
Debugging Permissions and Restrictions
Debugging is a highly privileged operation, and therefore only members of the sysadmin fixed server role are allowed to do so in SQL Server.
- Debugging CLR routines is restricted to one debugger instance at a time.
- All CLR code execution freezes when a breakpoint is hit, and execution does not continue until the debugger advances from the breakpoint.
- However, you can continue debugging Transact-SQL in other connections.
- Because Transact-SQL debugging does not freeze other executions on the server, it could cause other connections to wait by holding a lock.
- Existing connections cannot be debugged, only new connections, as SQL Server requires information about the client and debugger environment before the connection can be made.
