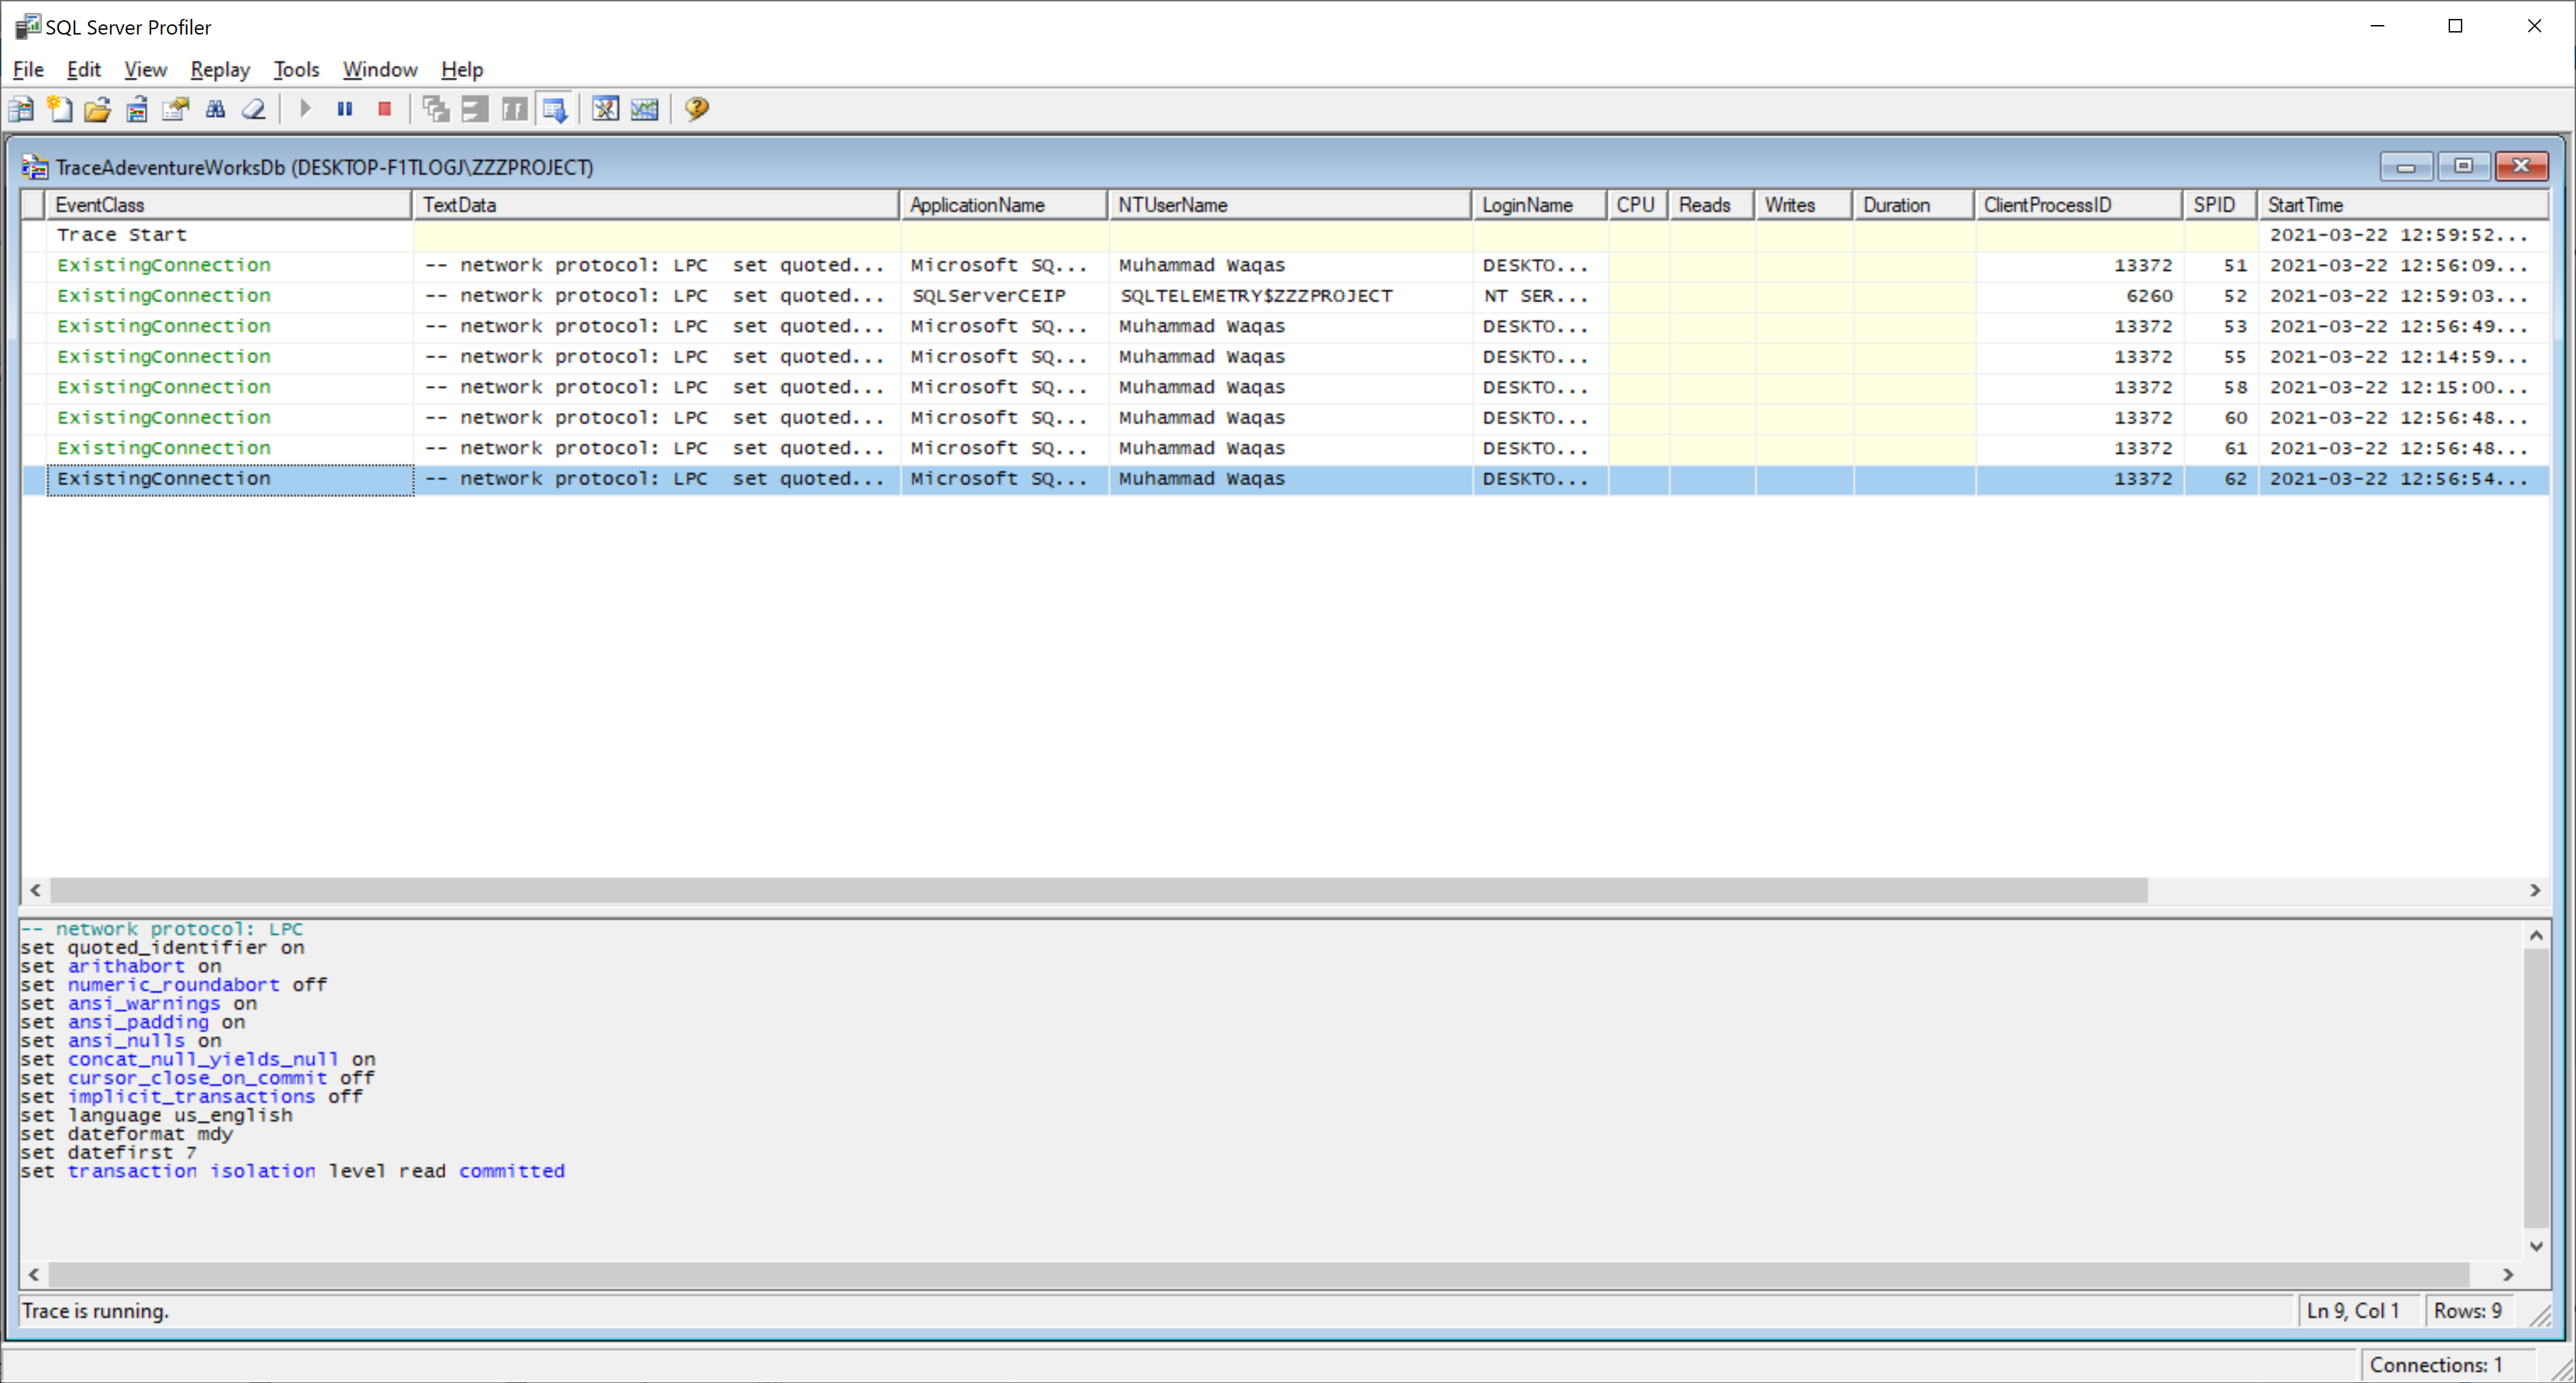
SQL Server Profiler Run SQL Server Profiler
SQL Server Profiler is a standalone tool installed with SQL Server. You can access it from Windows Explorer or SQL Server Management Studio.
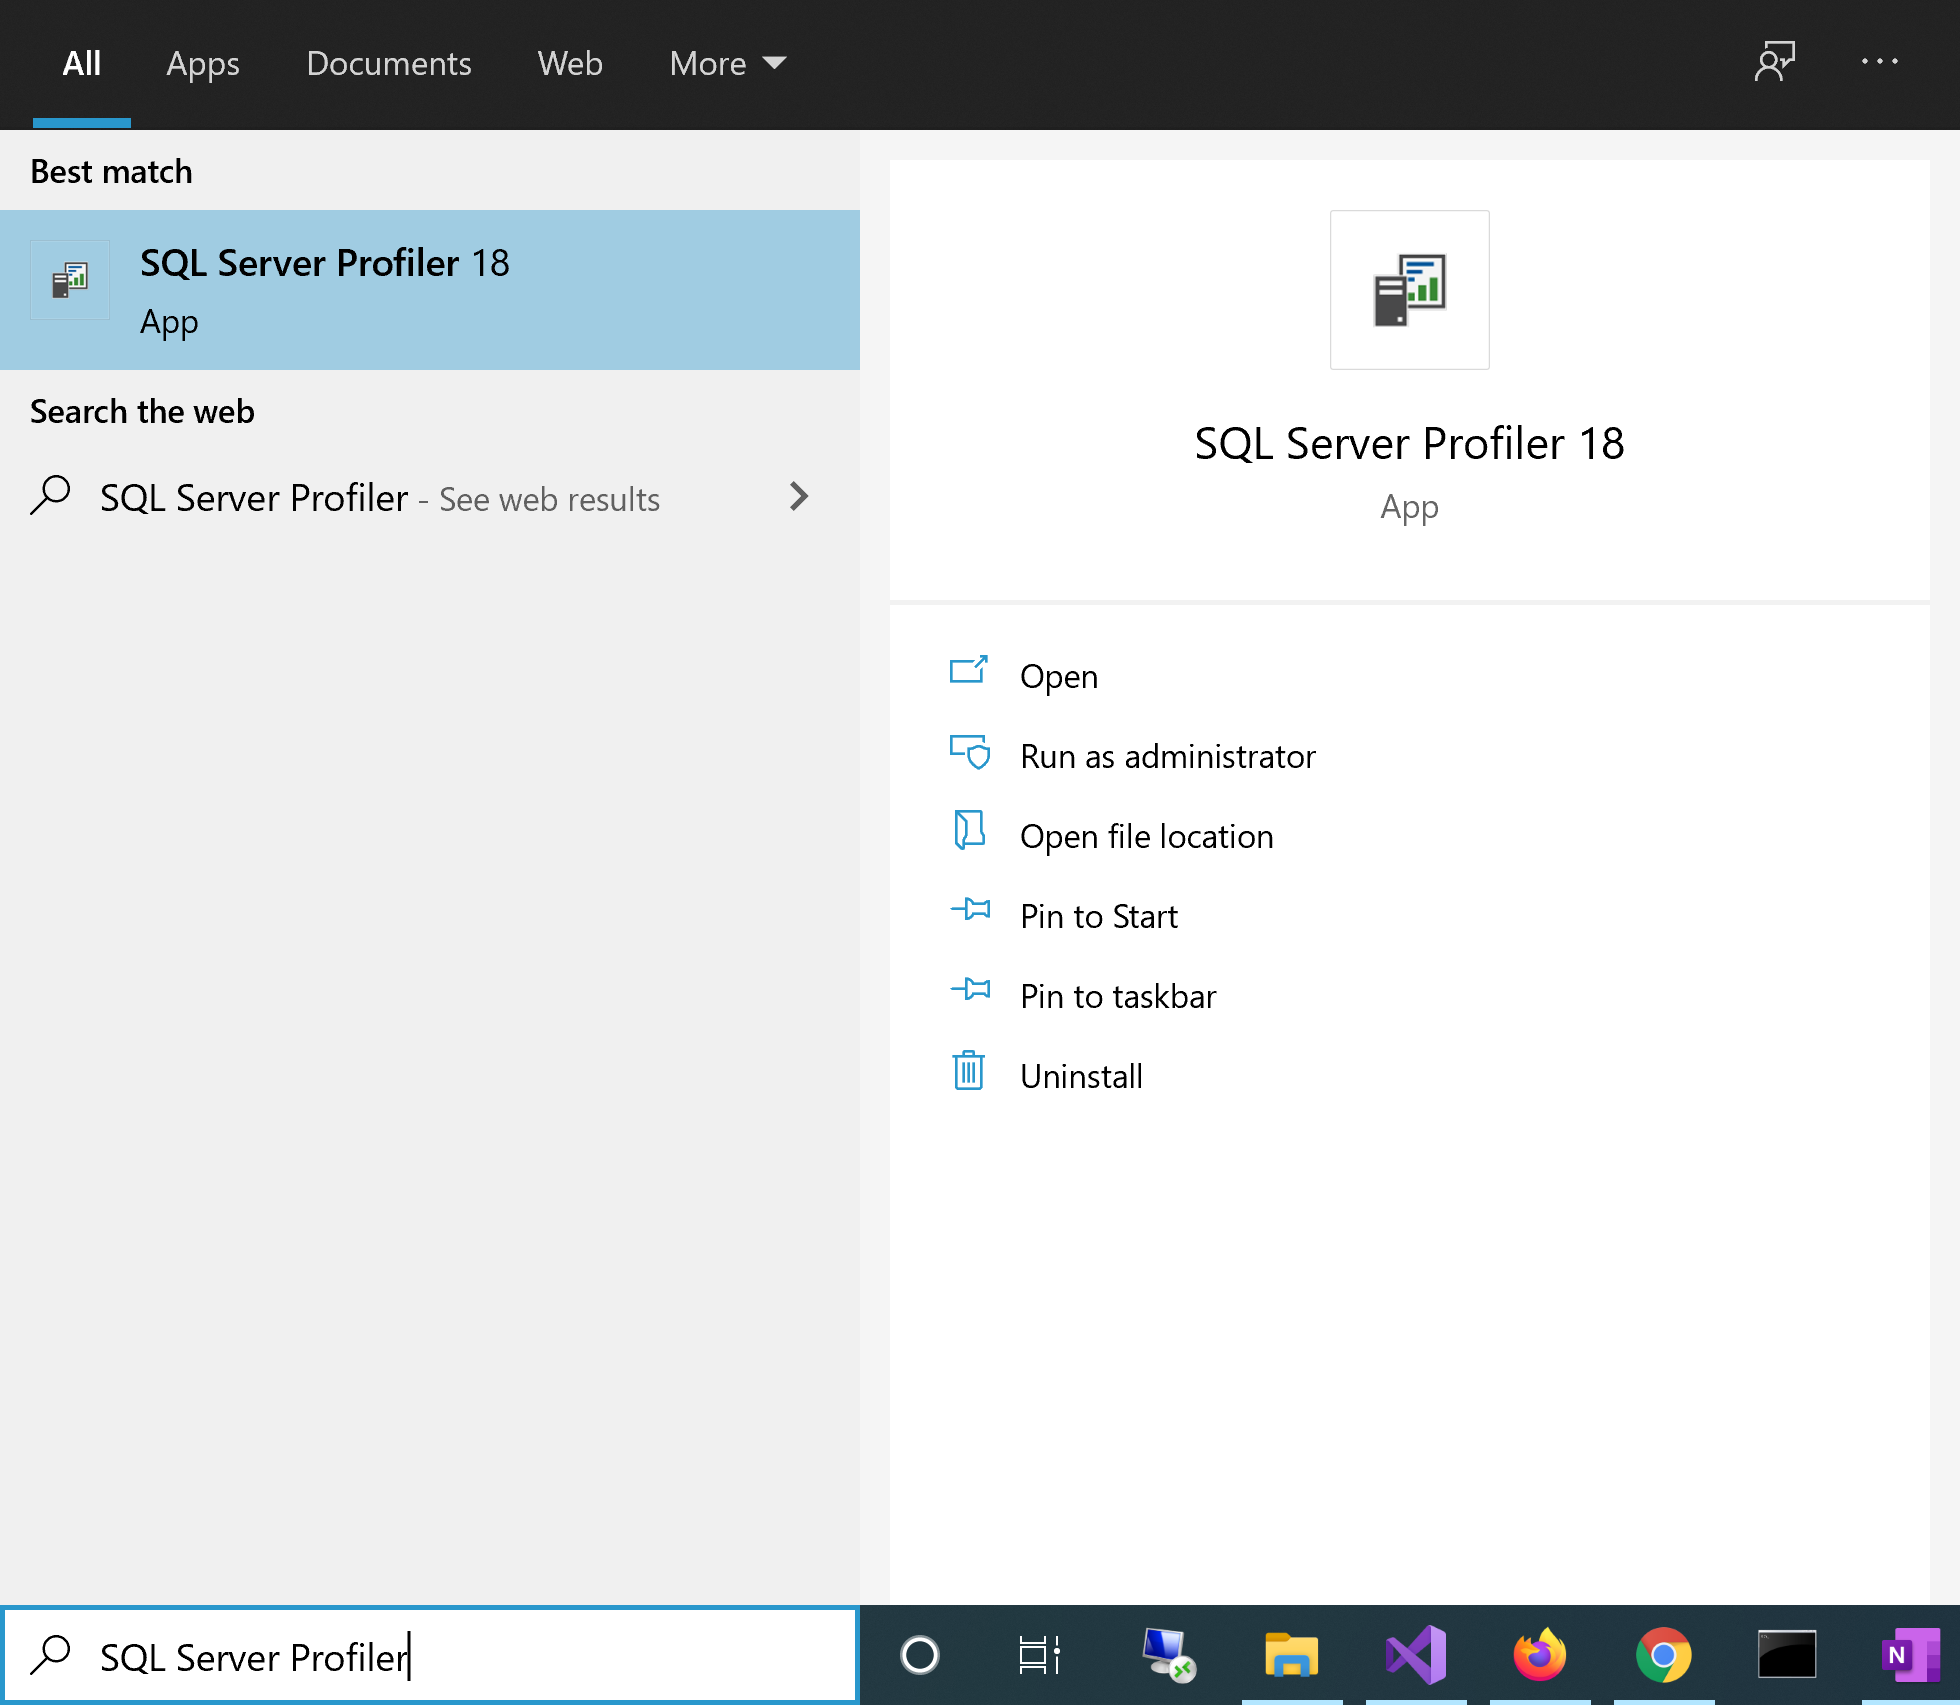
You can write SQL Server Profiler in the Start menu search bar, and you will see the application there.
You can also launch the Profiler from SQL Server Management Studio by opening the SQL Server Management Studio and connecting to the server instance.
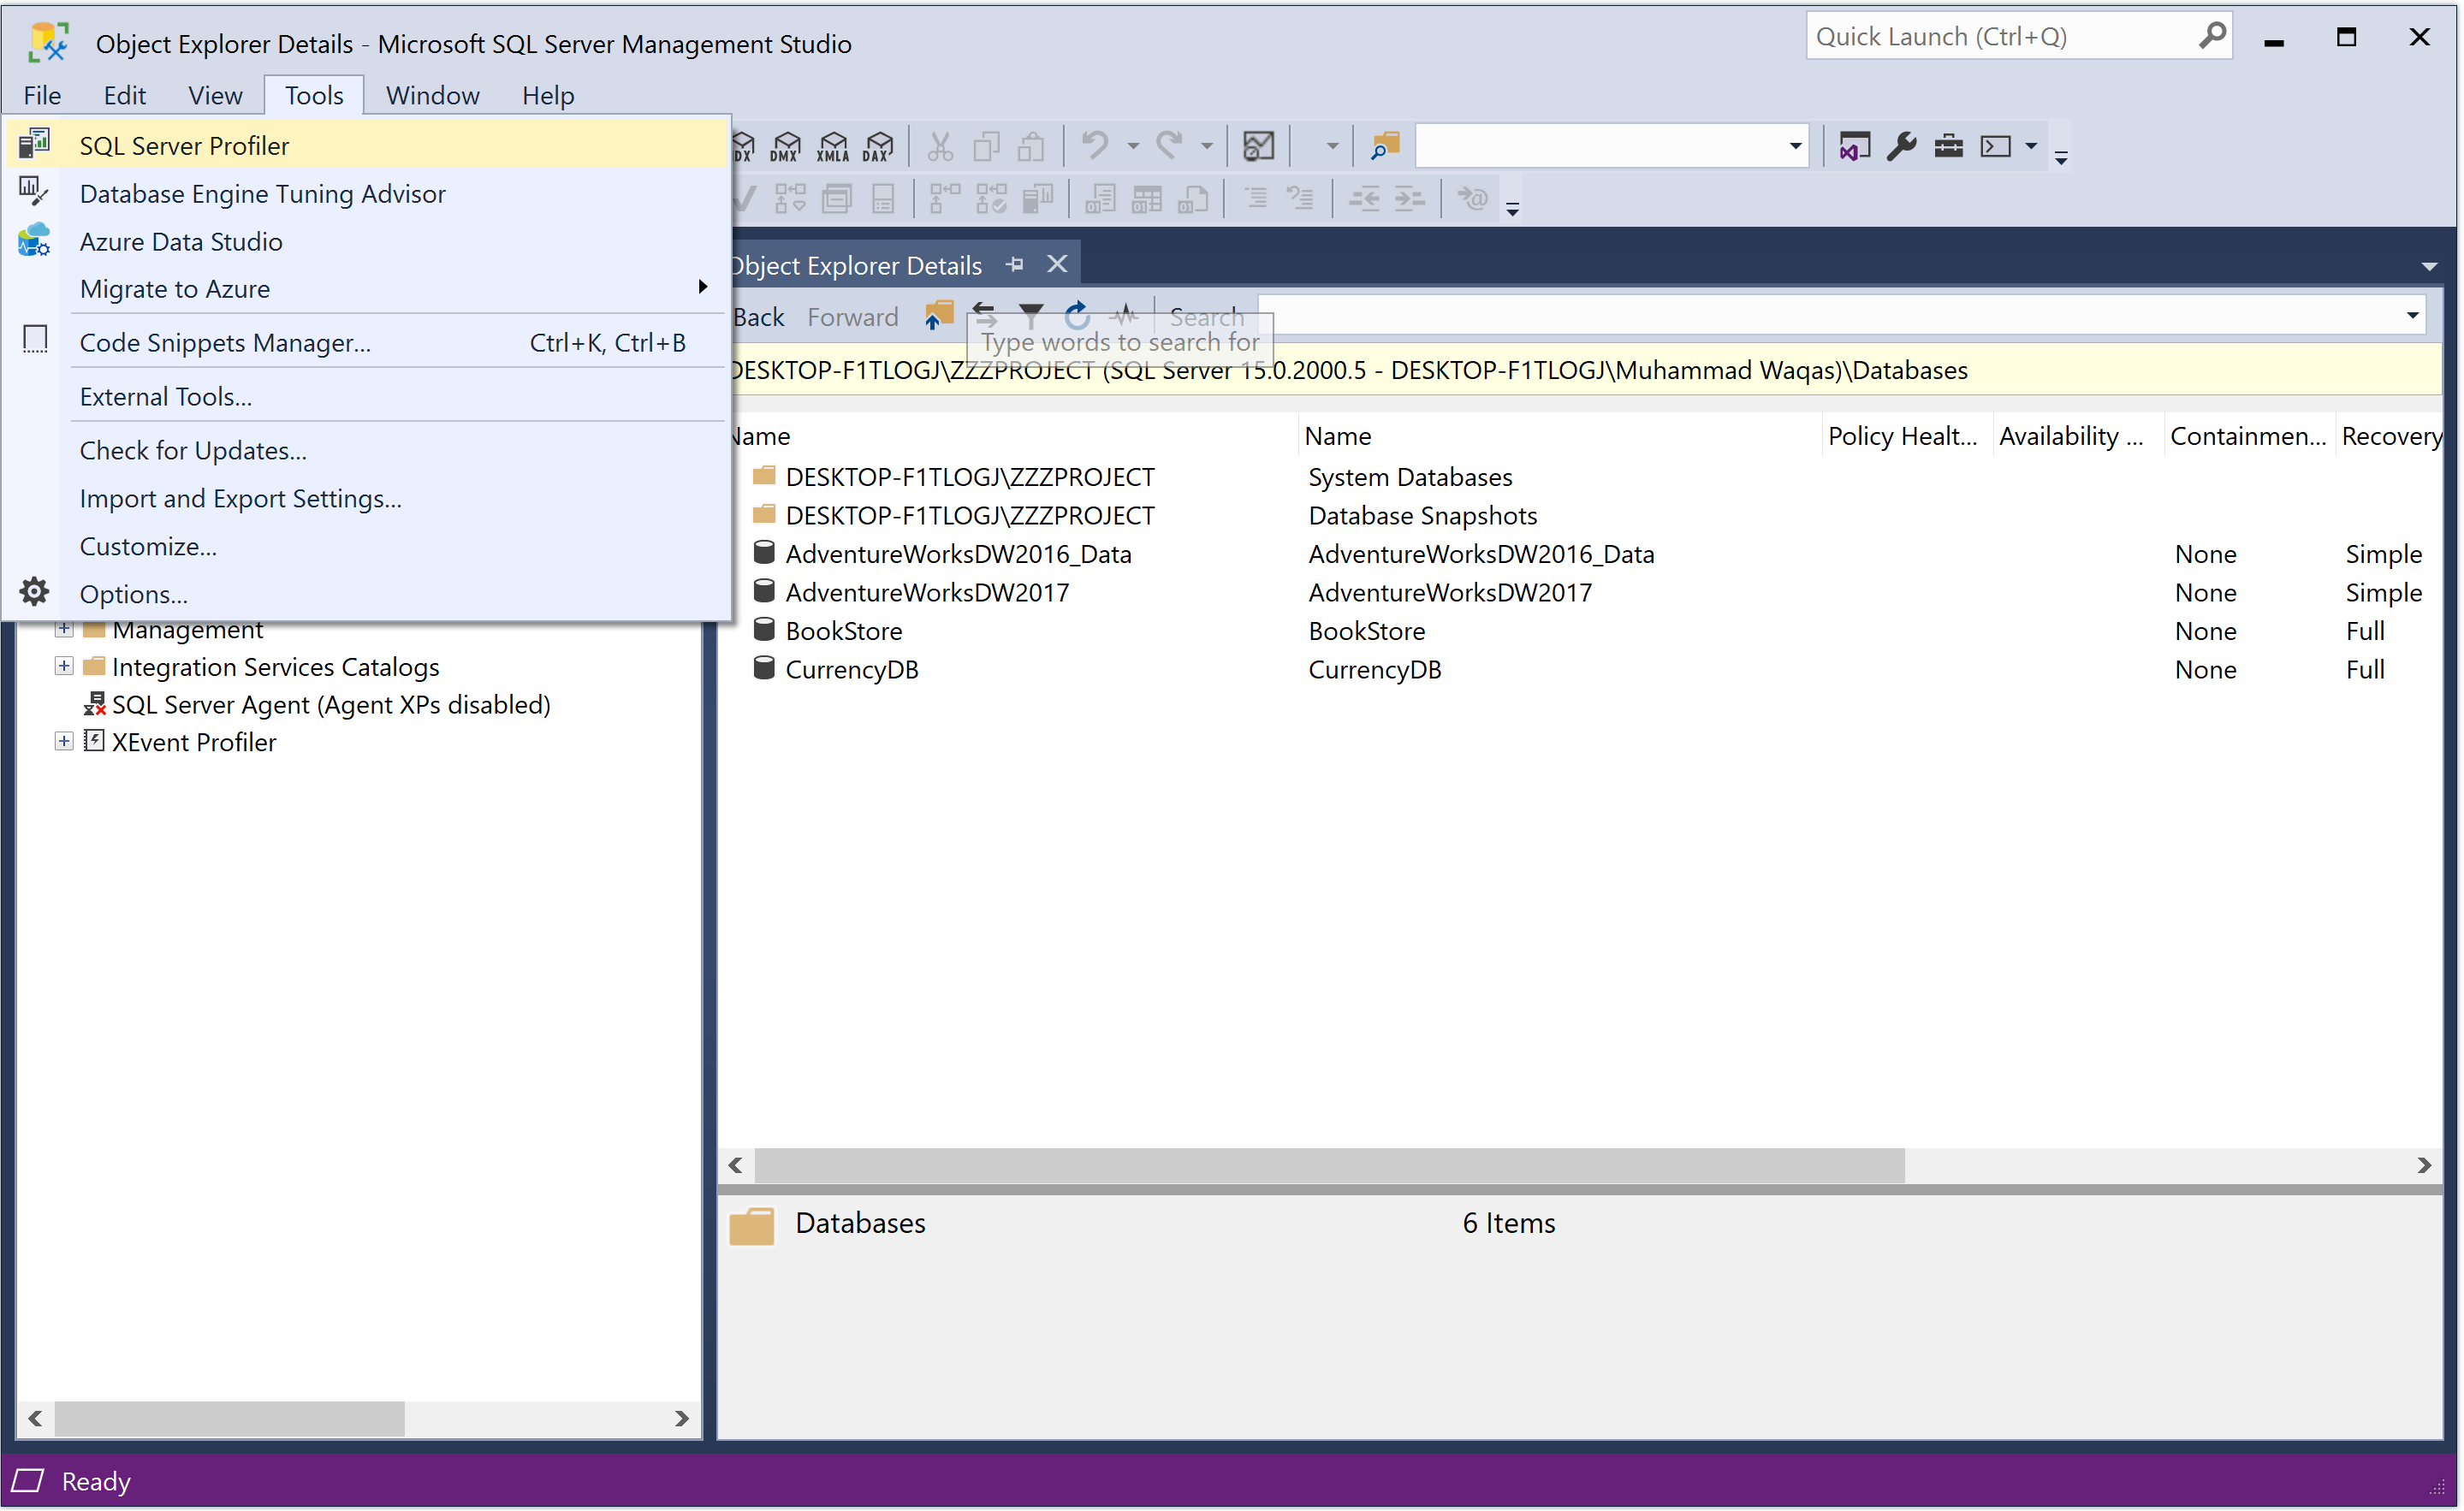
Now, select the Tools > SQL Server Profiler, and it will open the Connect to Server dialog.
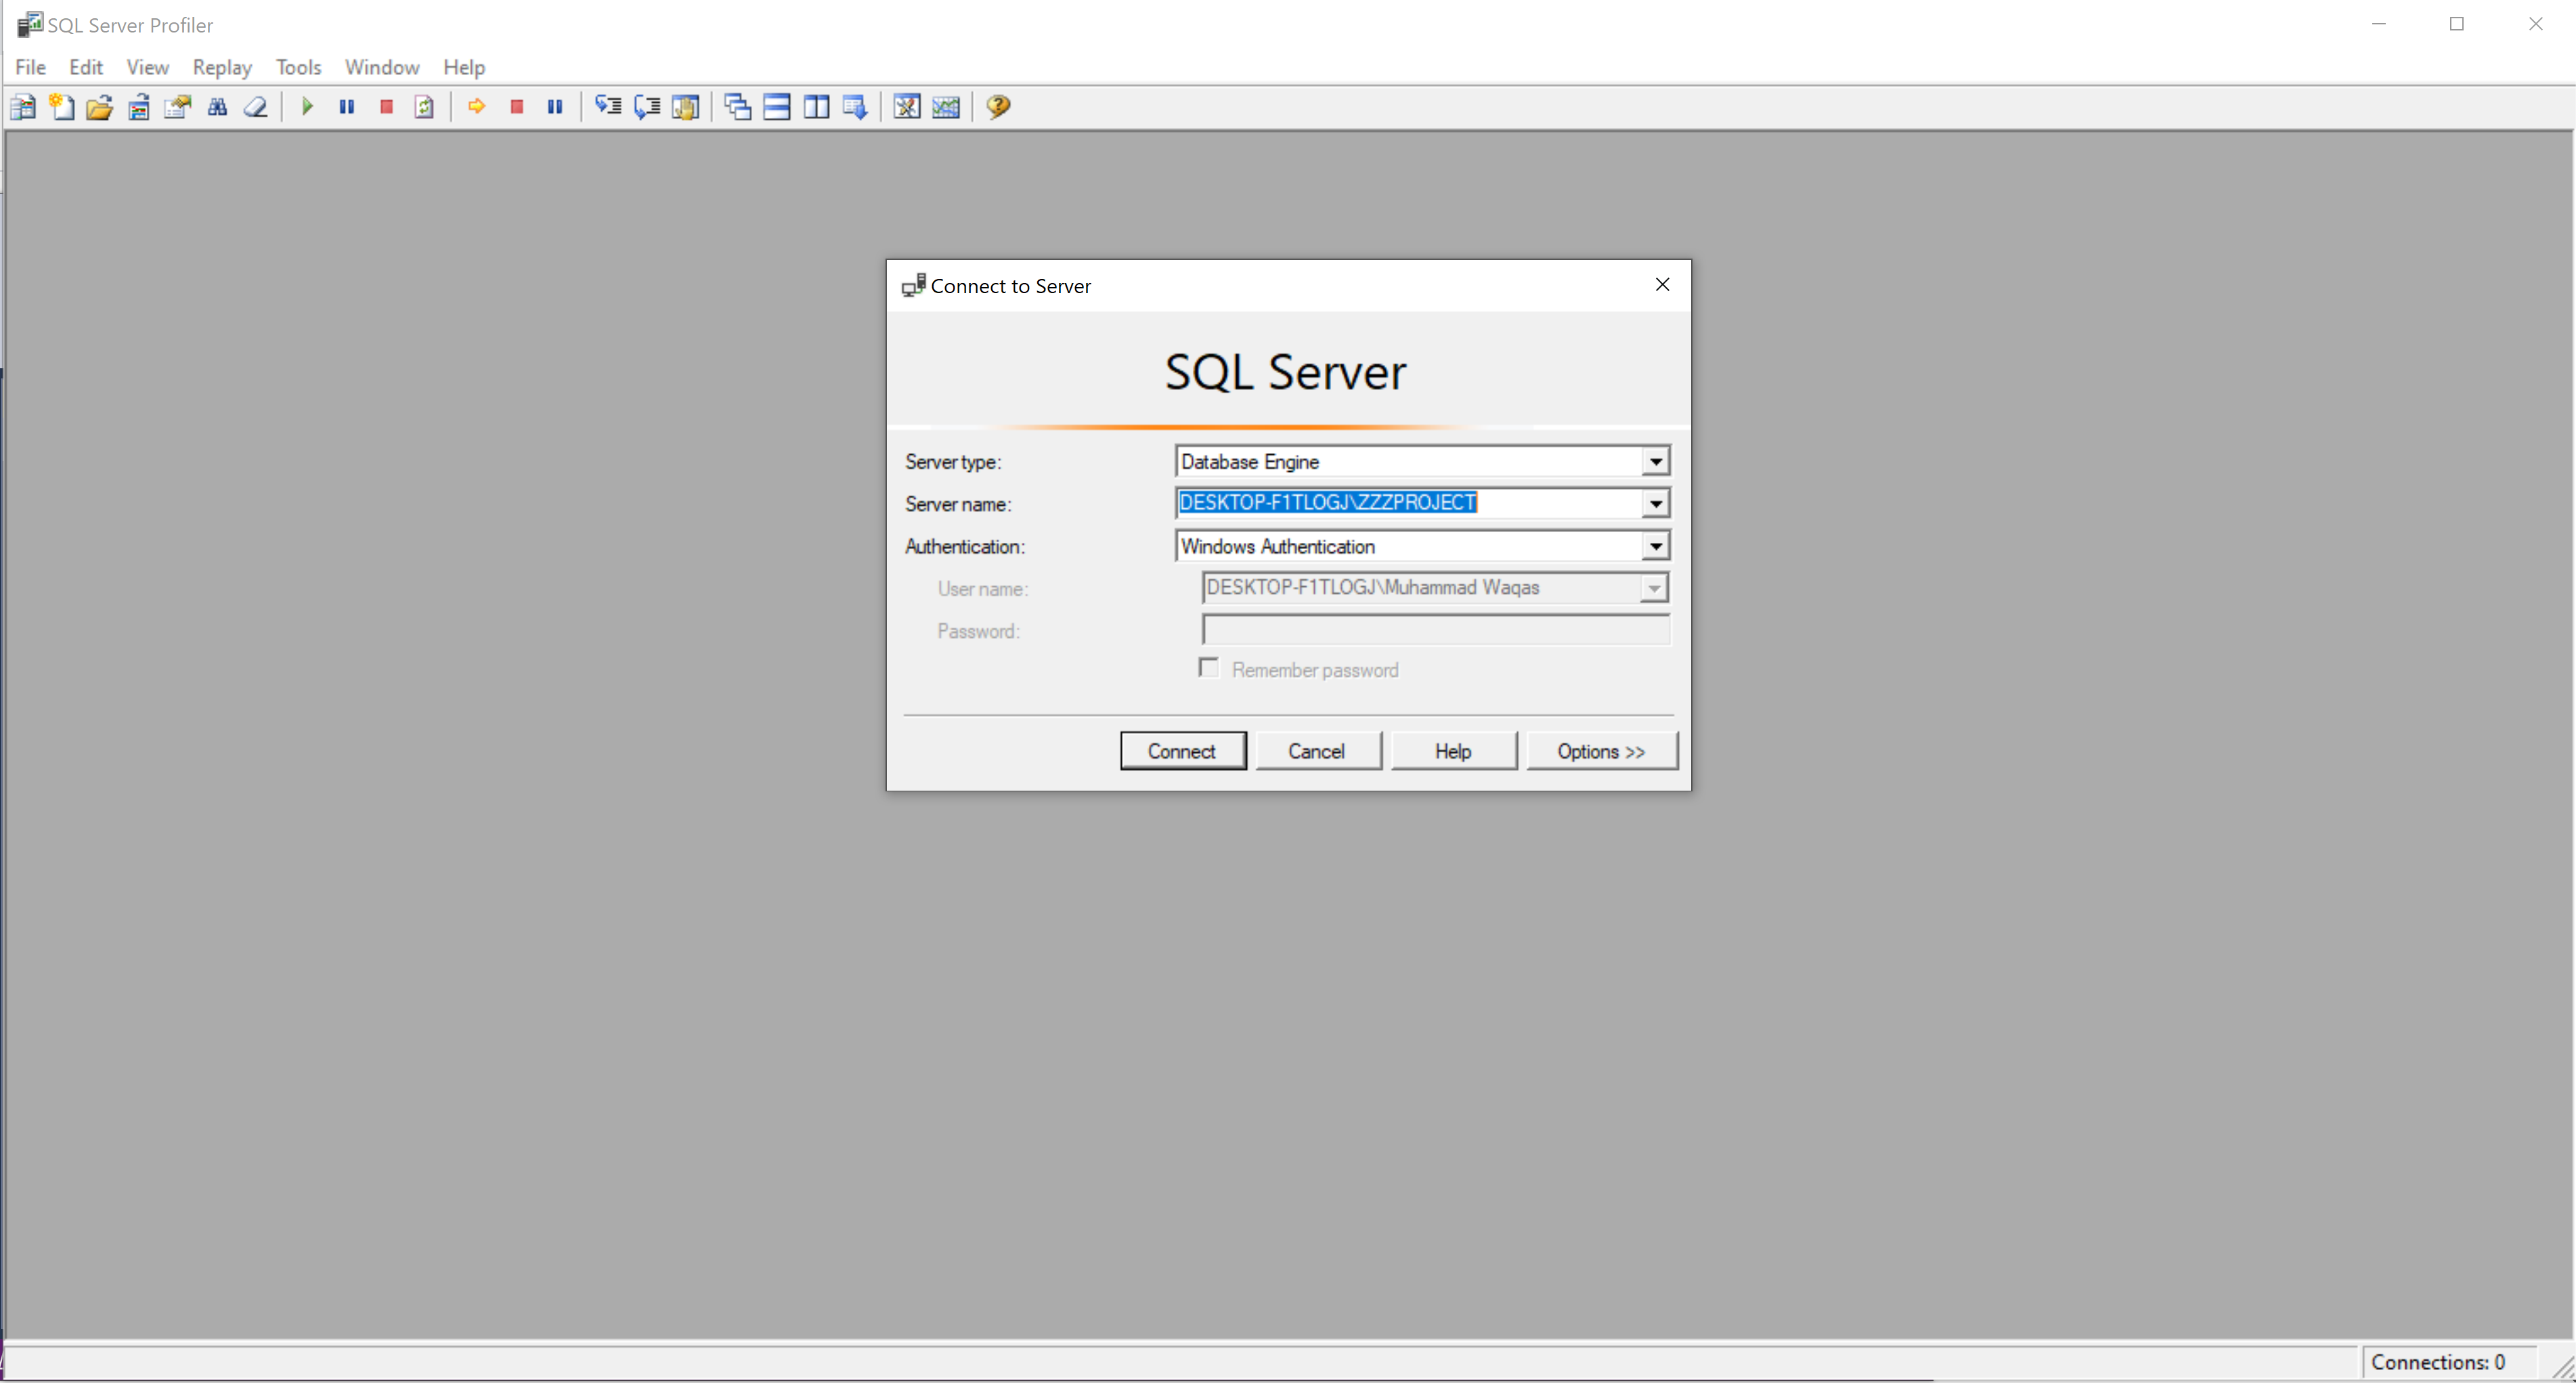
You have to select whether you need to connect to an Analysis Service instance or a Database Engine. When the connection is established, you will see a Trace Properties dialog.
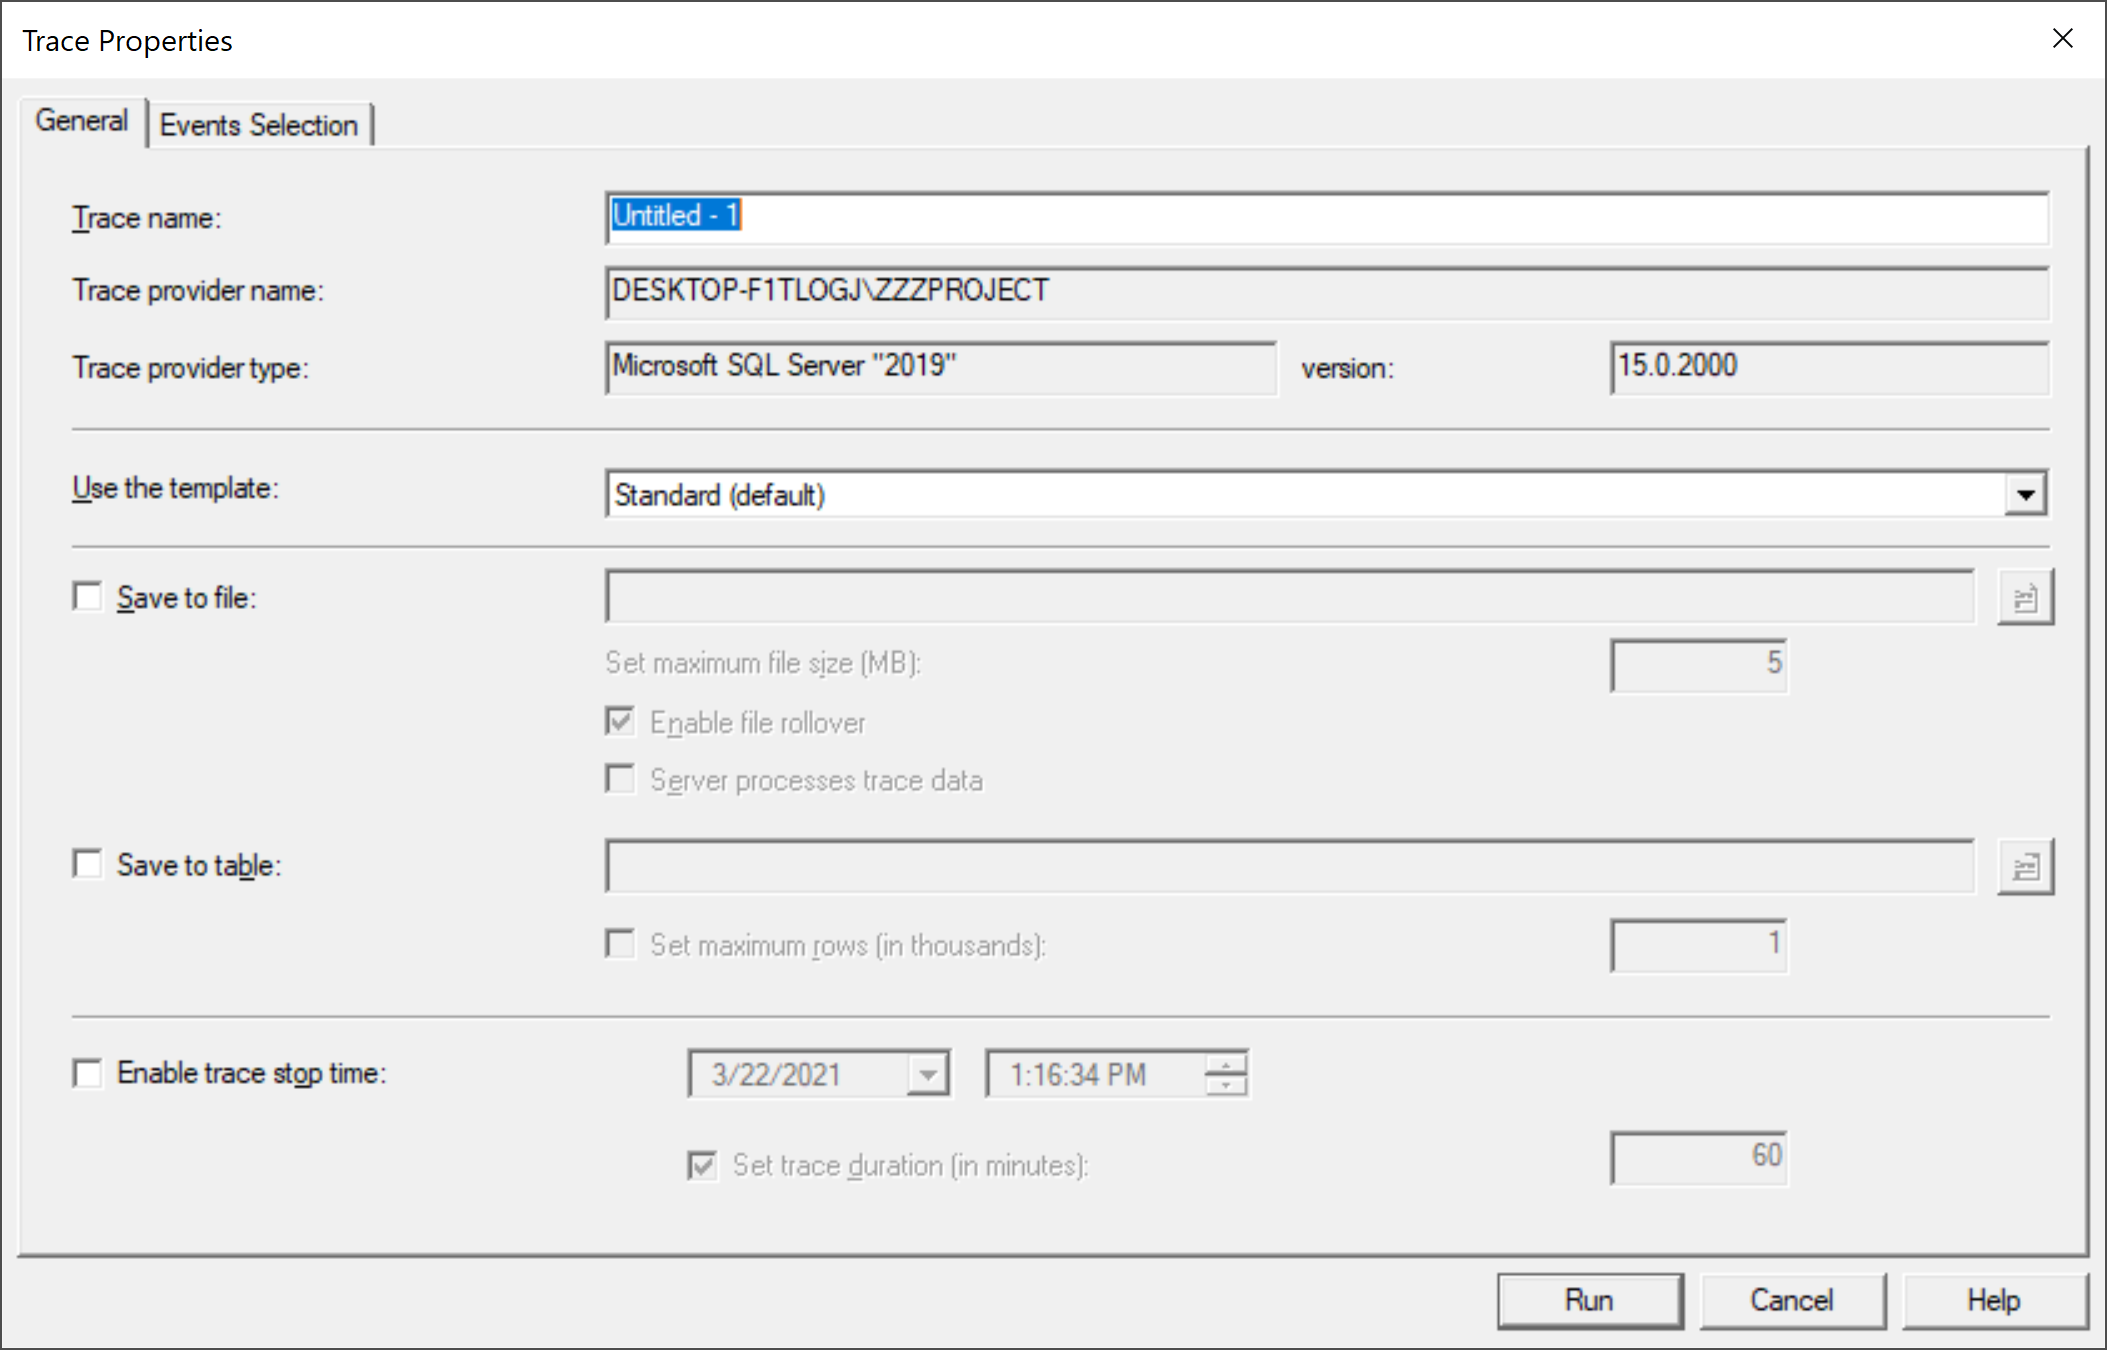
On the General tab, you could set the following settings.
- Enter the trace name
- You can choose a trace template from a drop-down listing primarily based totally to your needs.
- A template is a set of tuning events that are caught by the profiler trace.
- There are various predefine templates such as T-SQL, Tuning, or choosing the standard (default) template or beginning from scratch with a Blank template.
- You can choose whether or not you want to keep the trace effects right into a database or file.
- You can also prevent the trace at a particular date-time.
In the Events Selection tab, you could choose all activities you want to include in the trace, and also you can not add some filters.
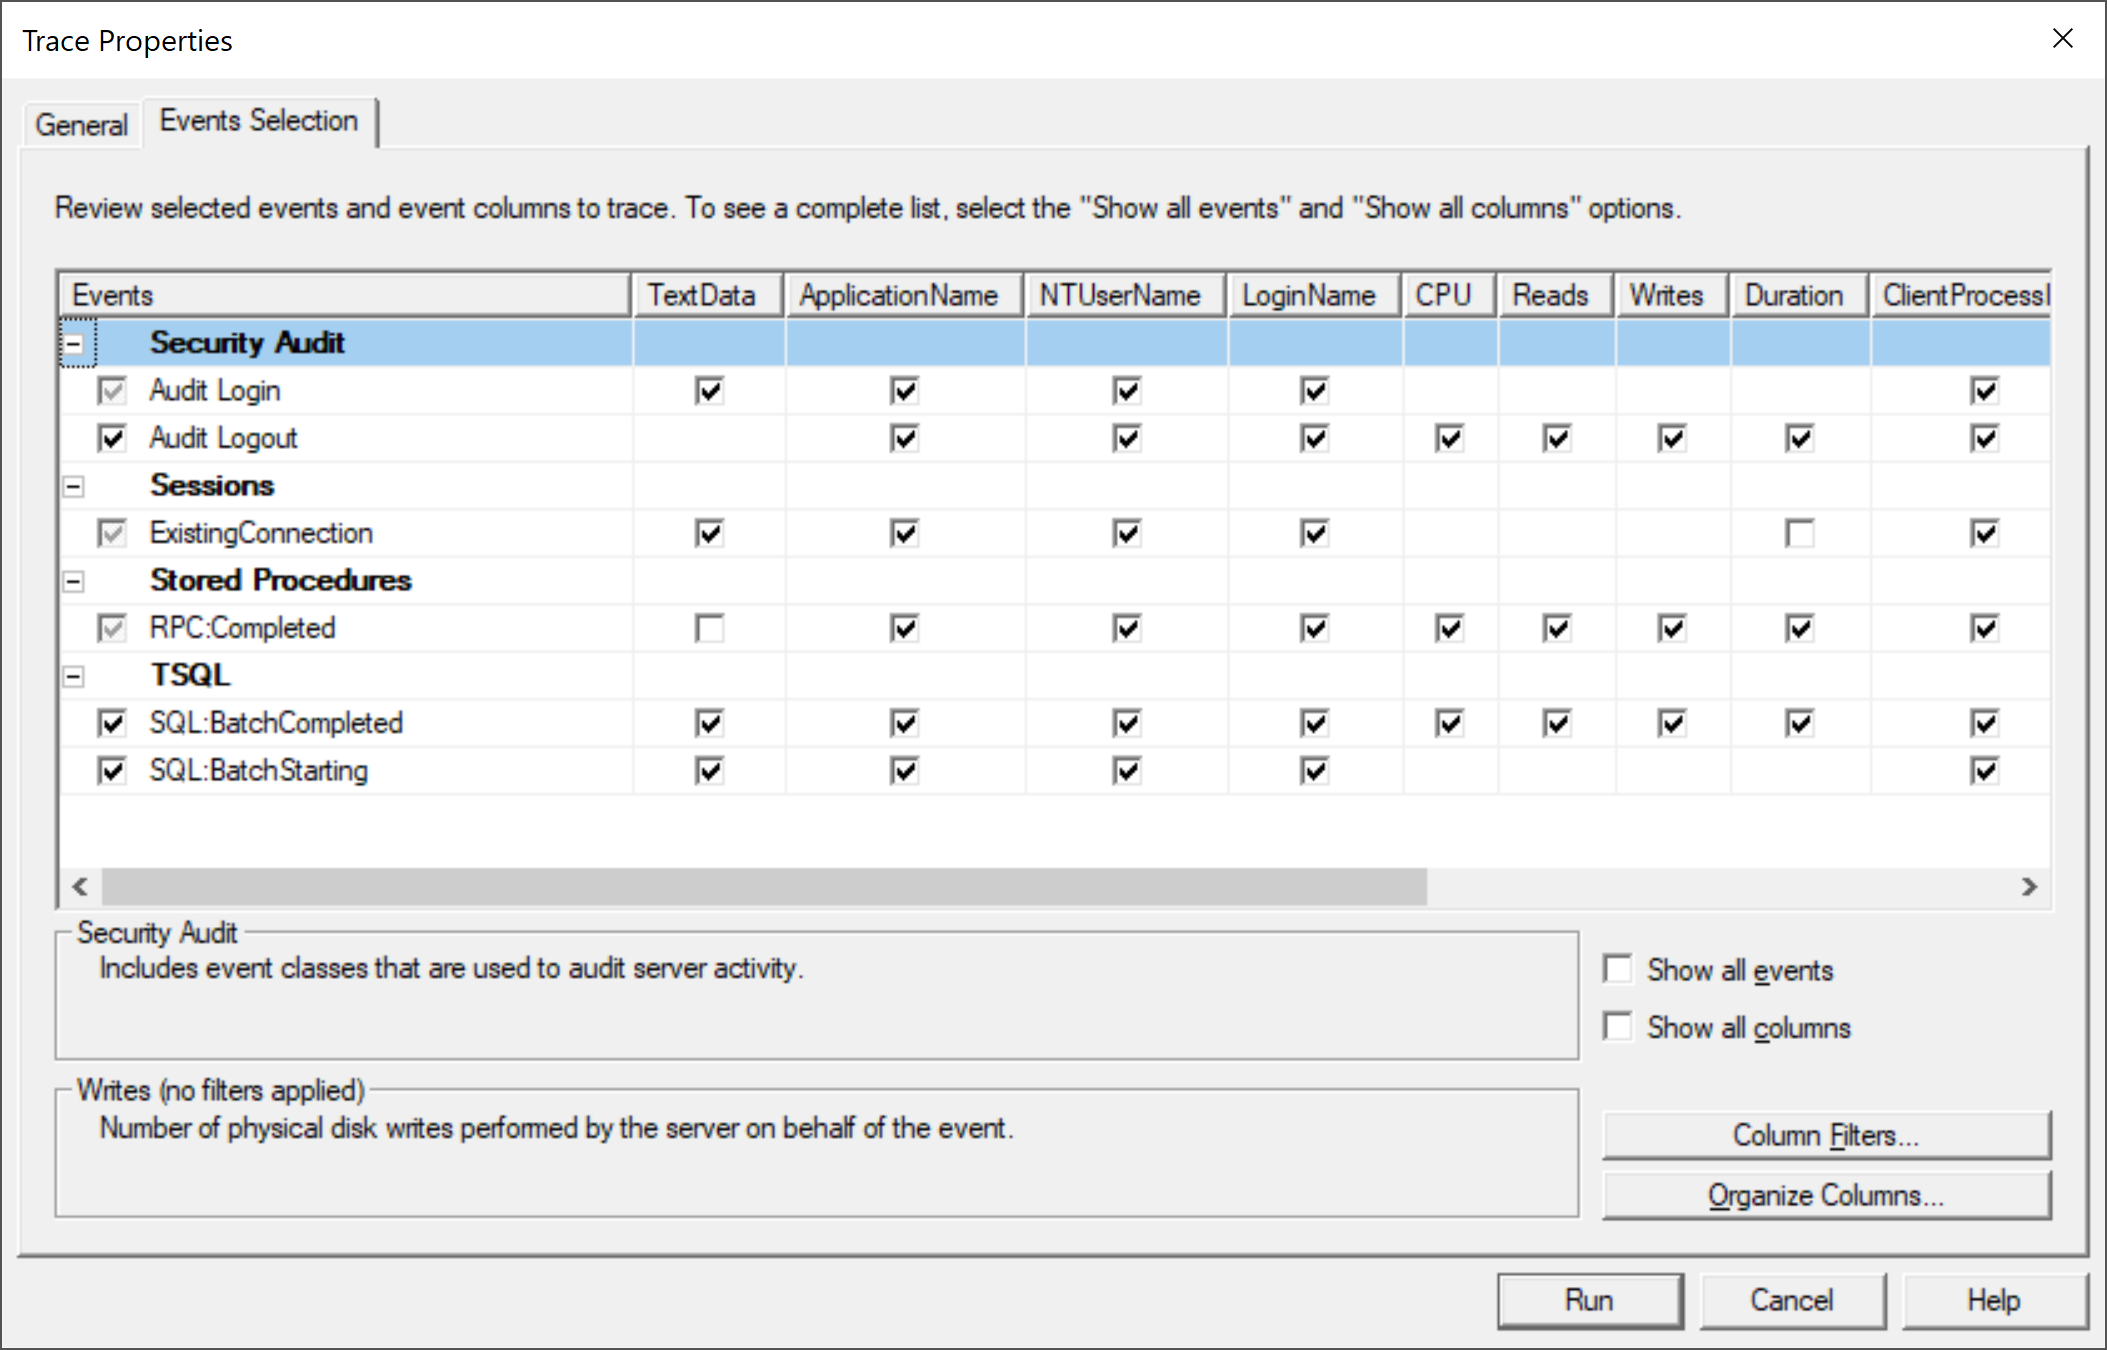
If you only need to trace the operations executed in a specific database, then you can add a filter on the database name property.
Now let's go to the General tab again, enter a name in the Trace name field, and select Save to a table checkbox. It will open the Connect to Server dialog.
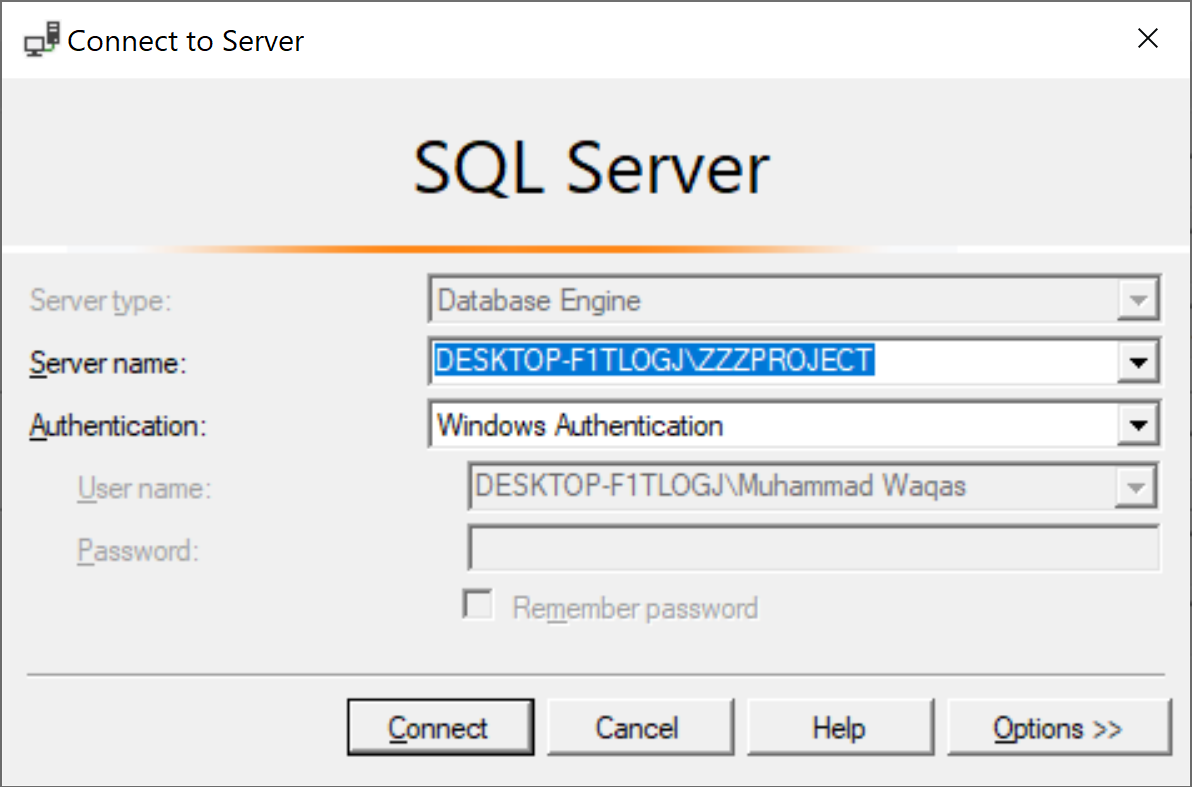
Click on the Connect button, and you will see a Destination Table dialog.
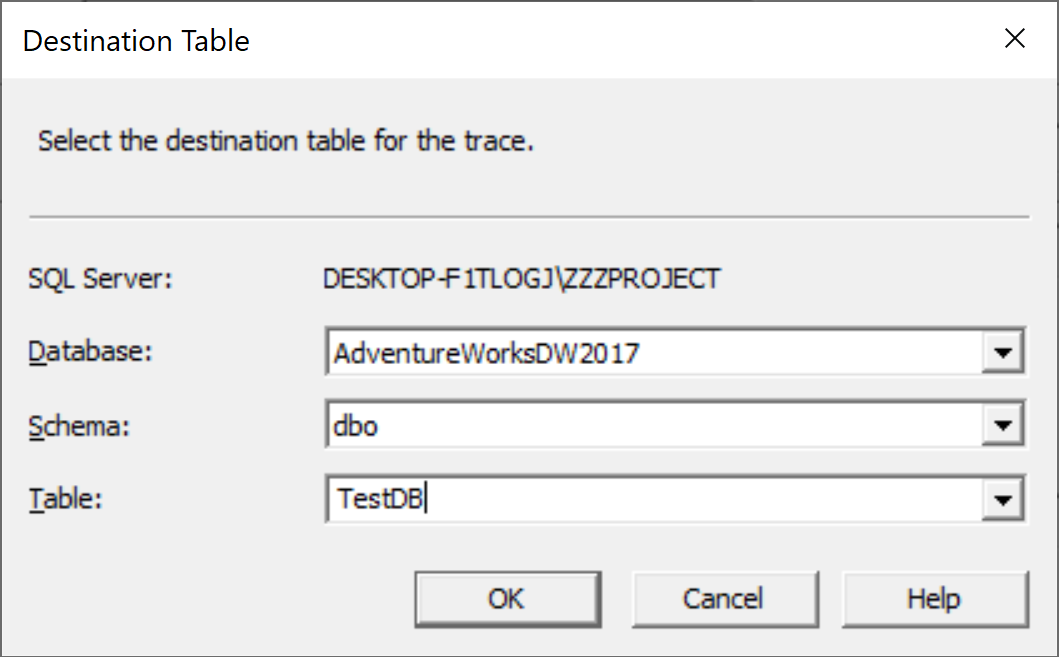
Select the destination table and click the OK button.
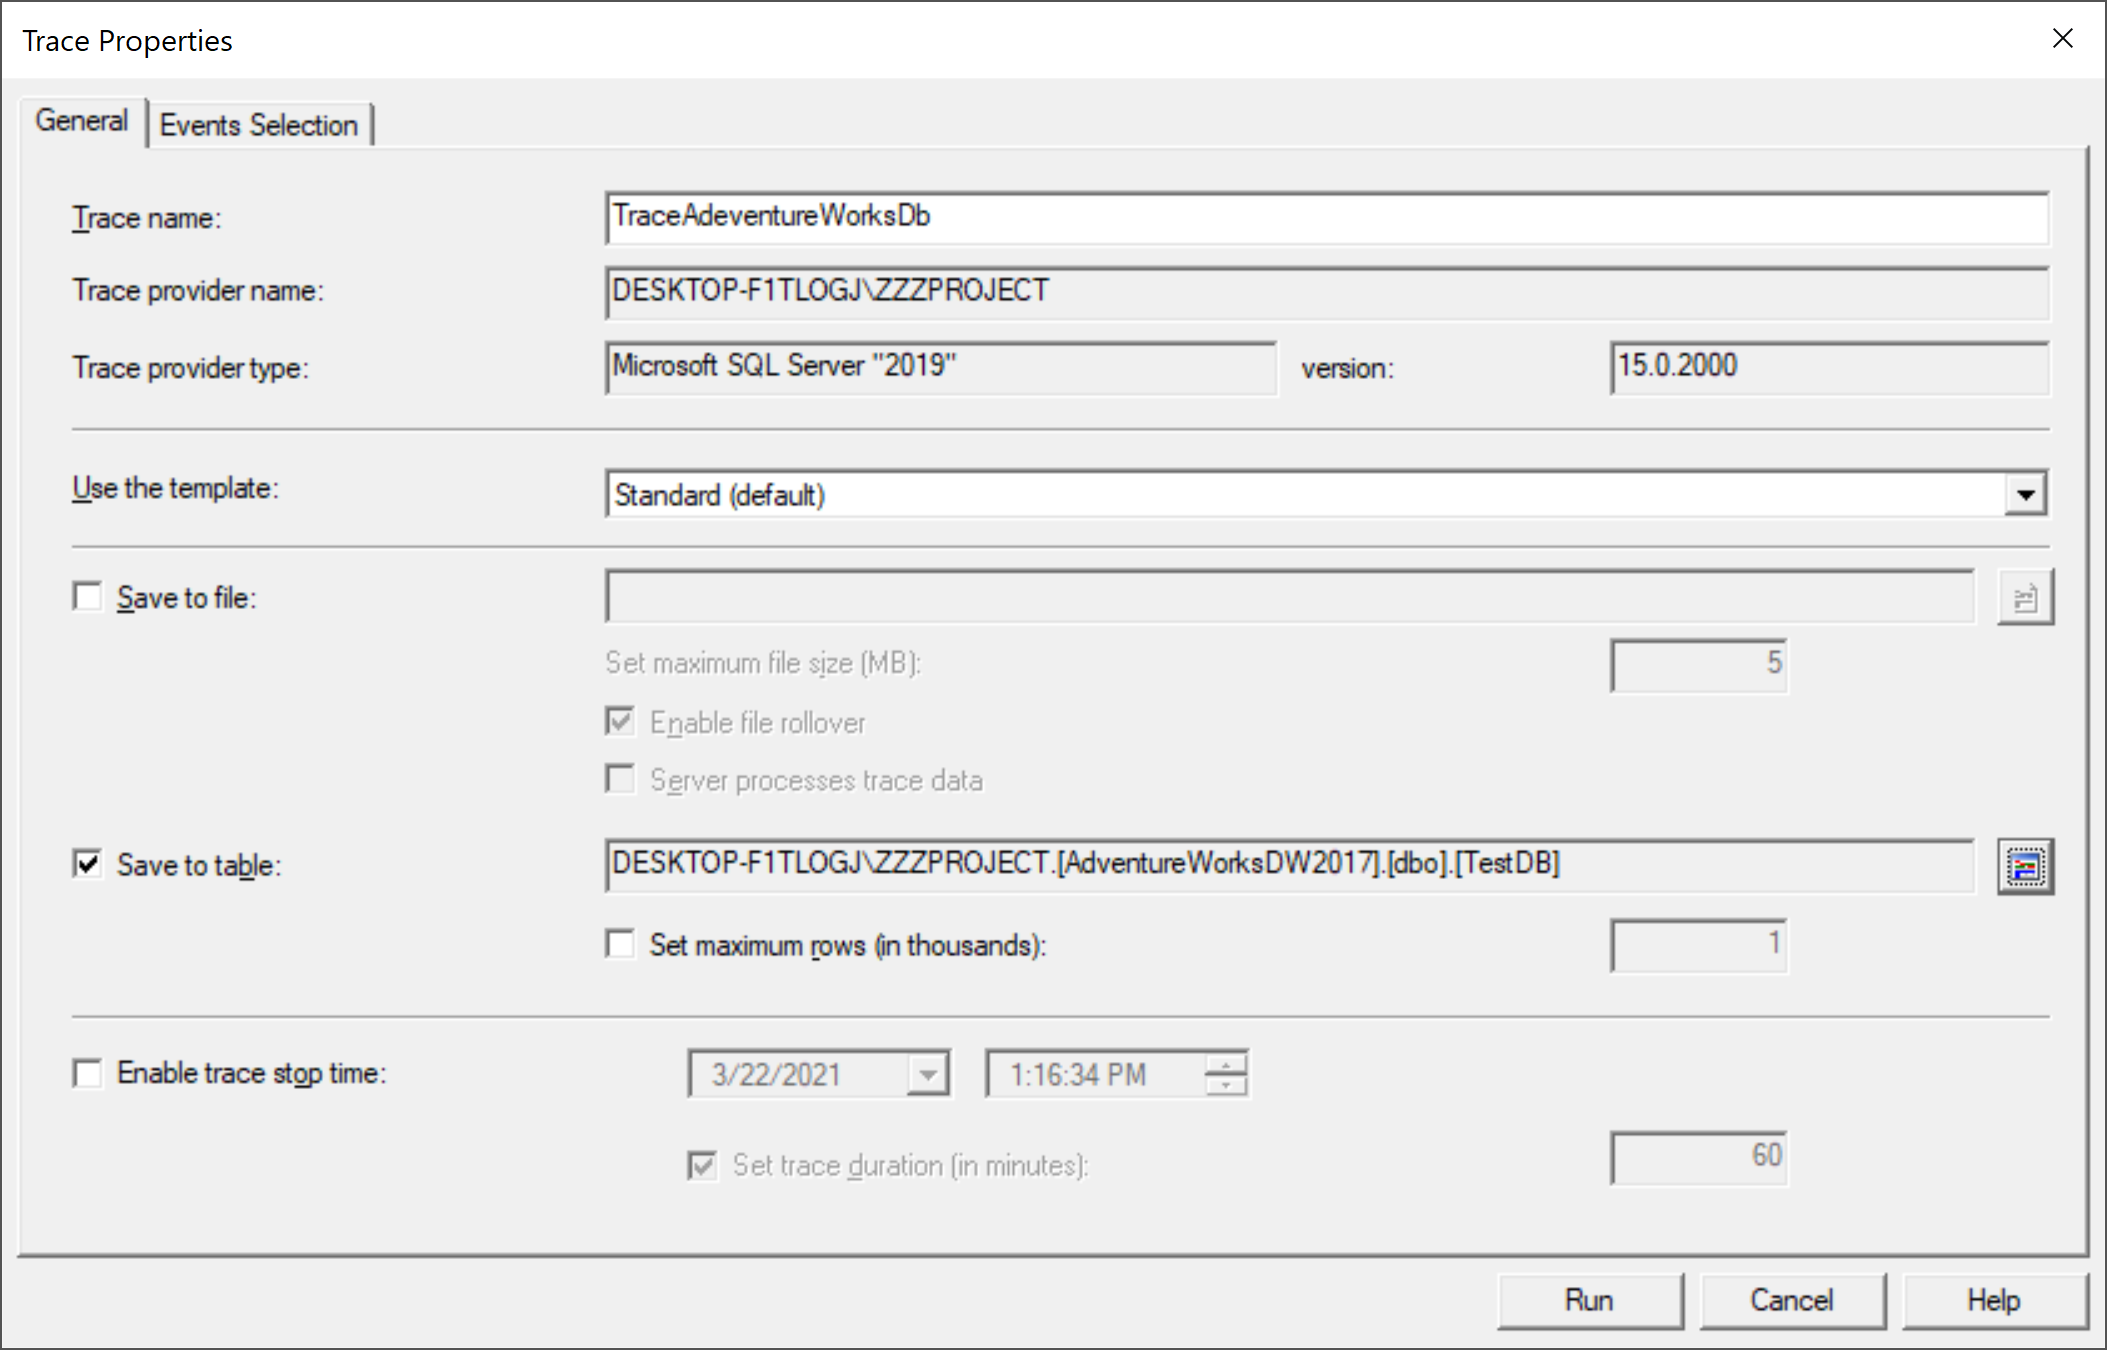
Now let's run the trace by clicking on the Run button.
