SQL Server Profiler Replay to a Breakpoint
Setting breakpoints in a trace file or table before you start to replay the trace enables you to pause the trace's replay at specific events. Using breakpoints while replaying a trace supports debugging because you can break the replay of long trace scripts into short segments that can be analyzed incrementally.
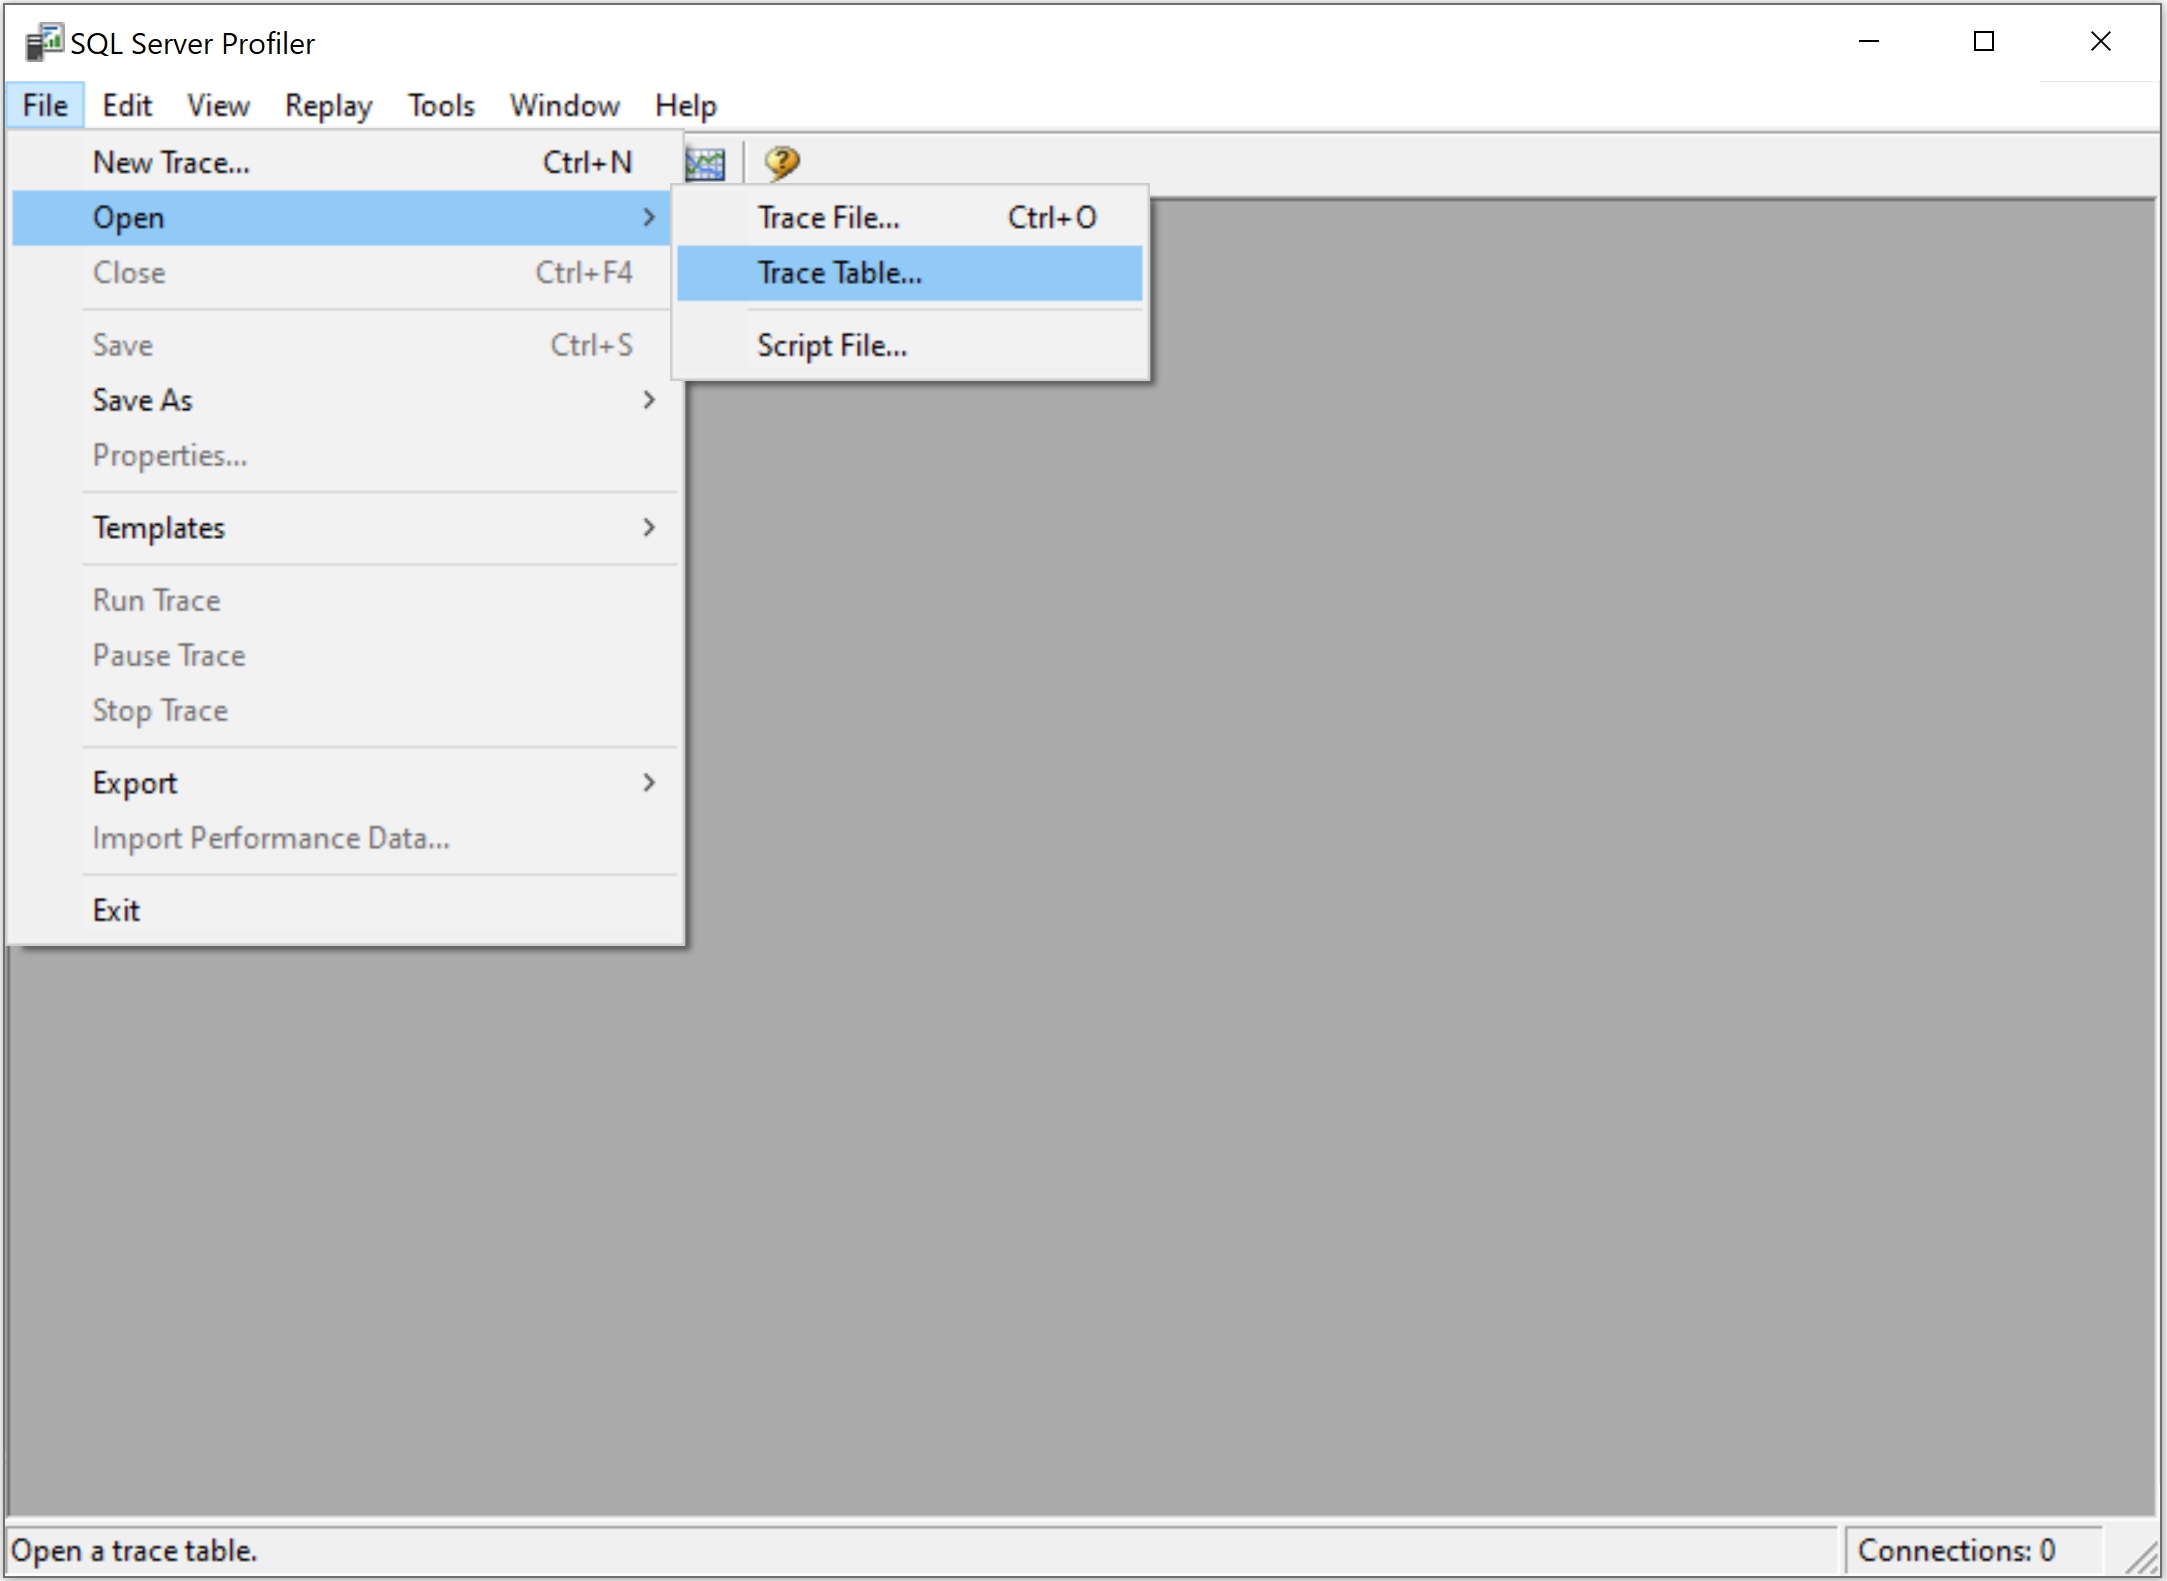
Let's open the SQL Server Profiler and go to the File > Open > Trace Table... menu.
It will open the Connect to Server dialog.
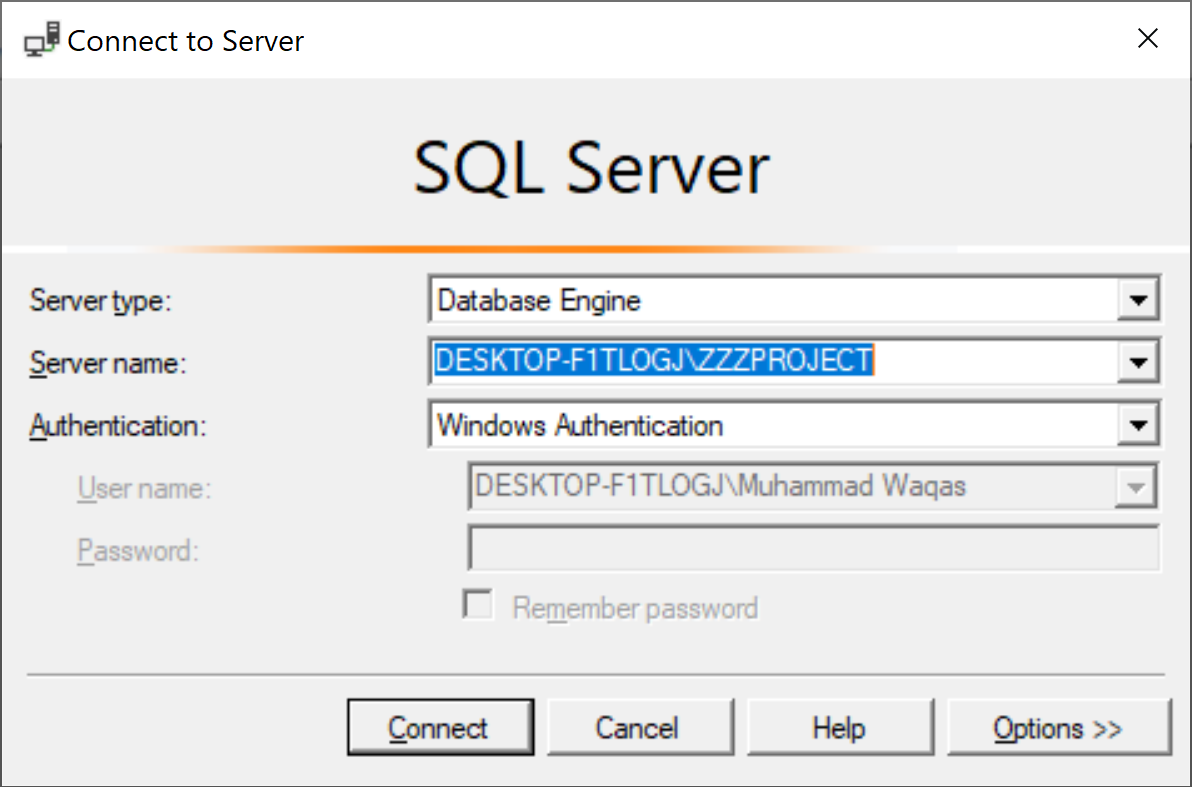
Click on the Connect button to connect to an instance of SQL Server.
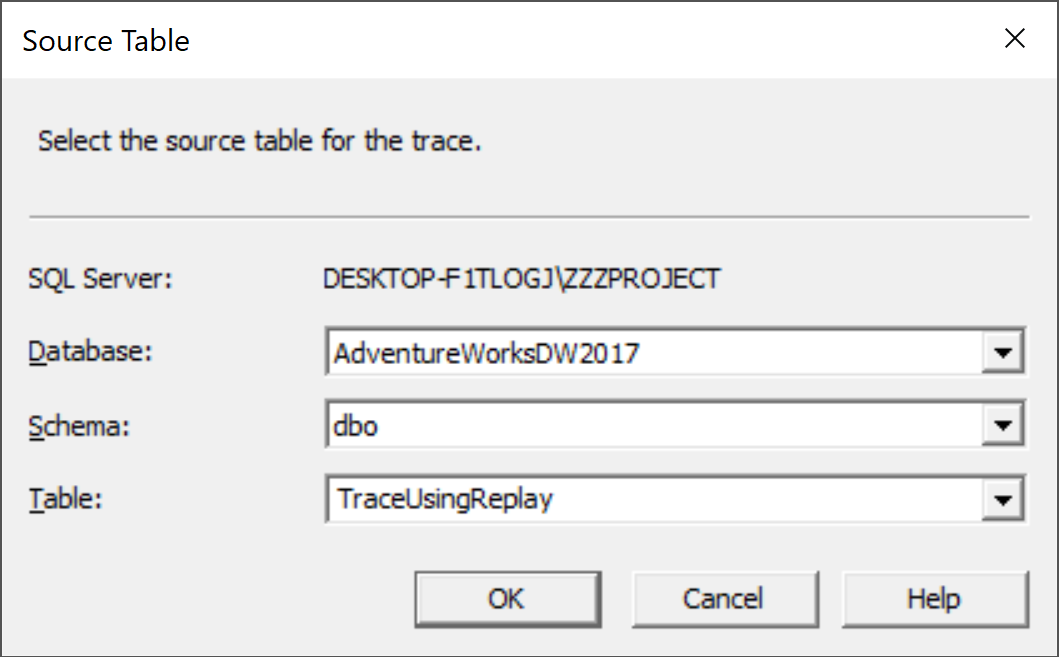
You will see a Destination Table dialog. Select the destination table and click the OK button.
Make sure that the trace table you open contains the event classes necessary for replay.
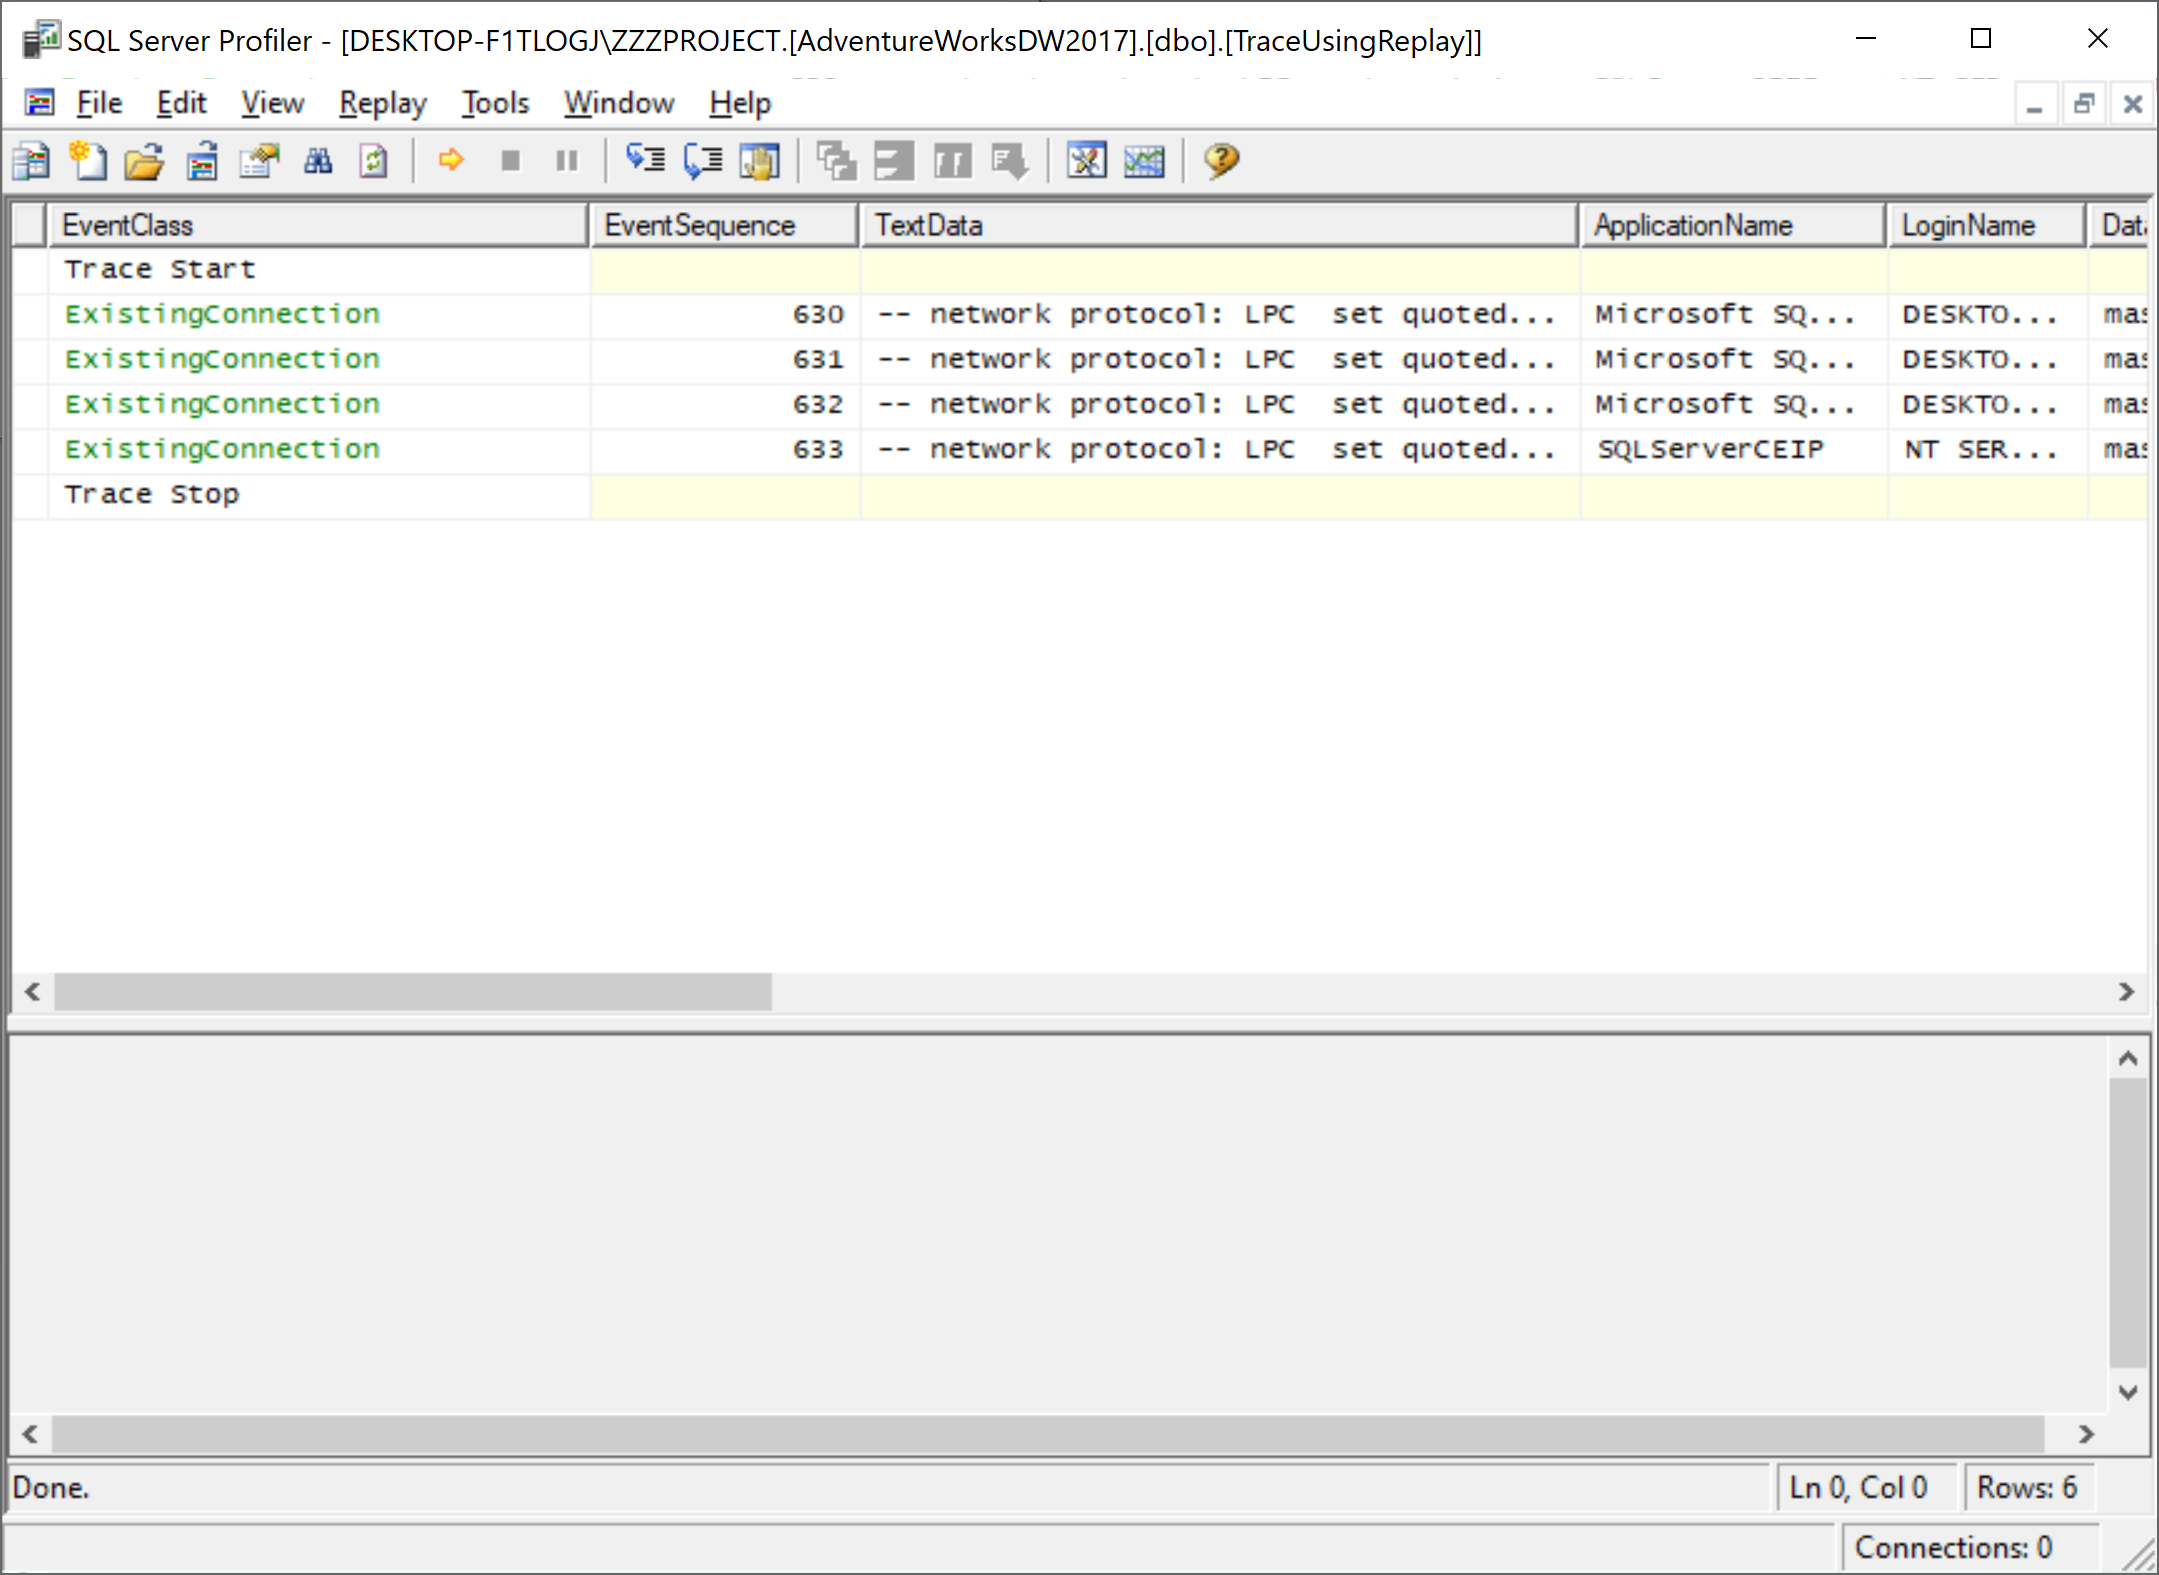
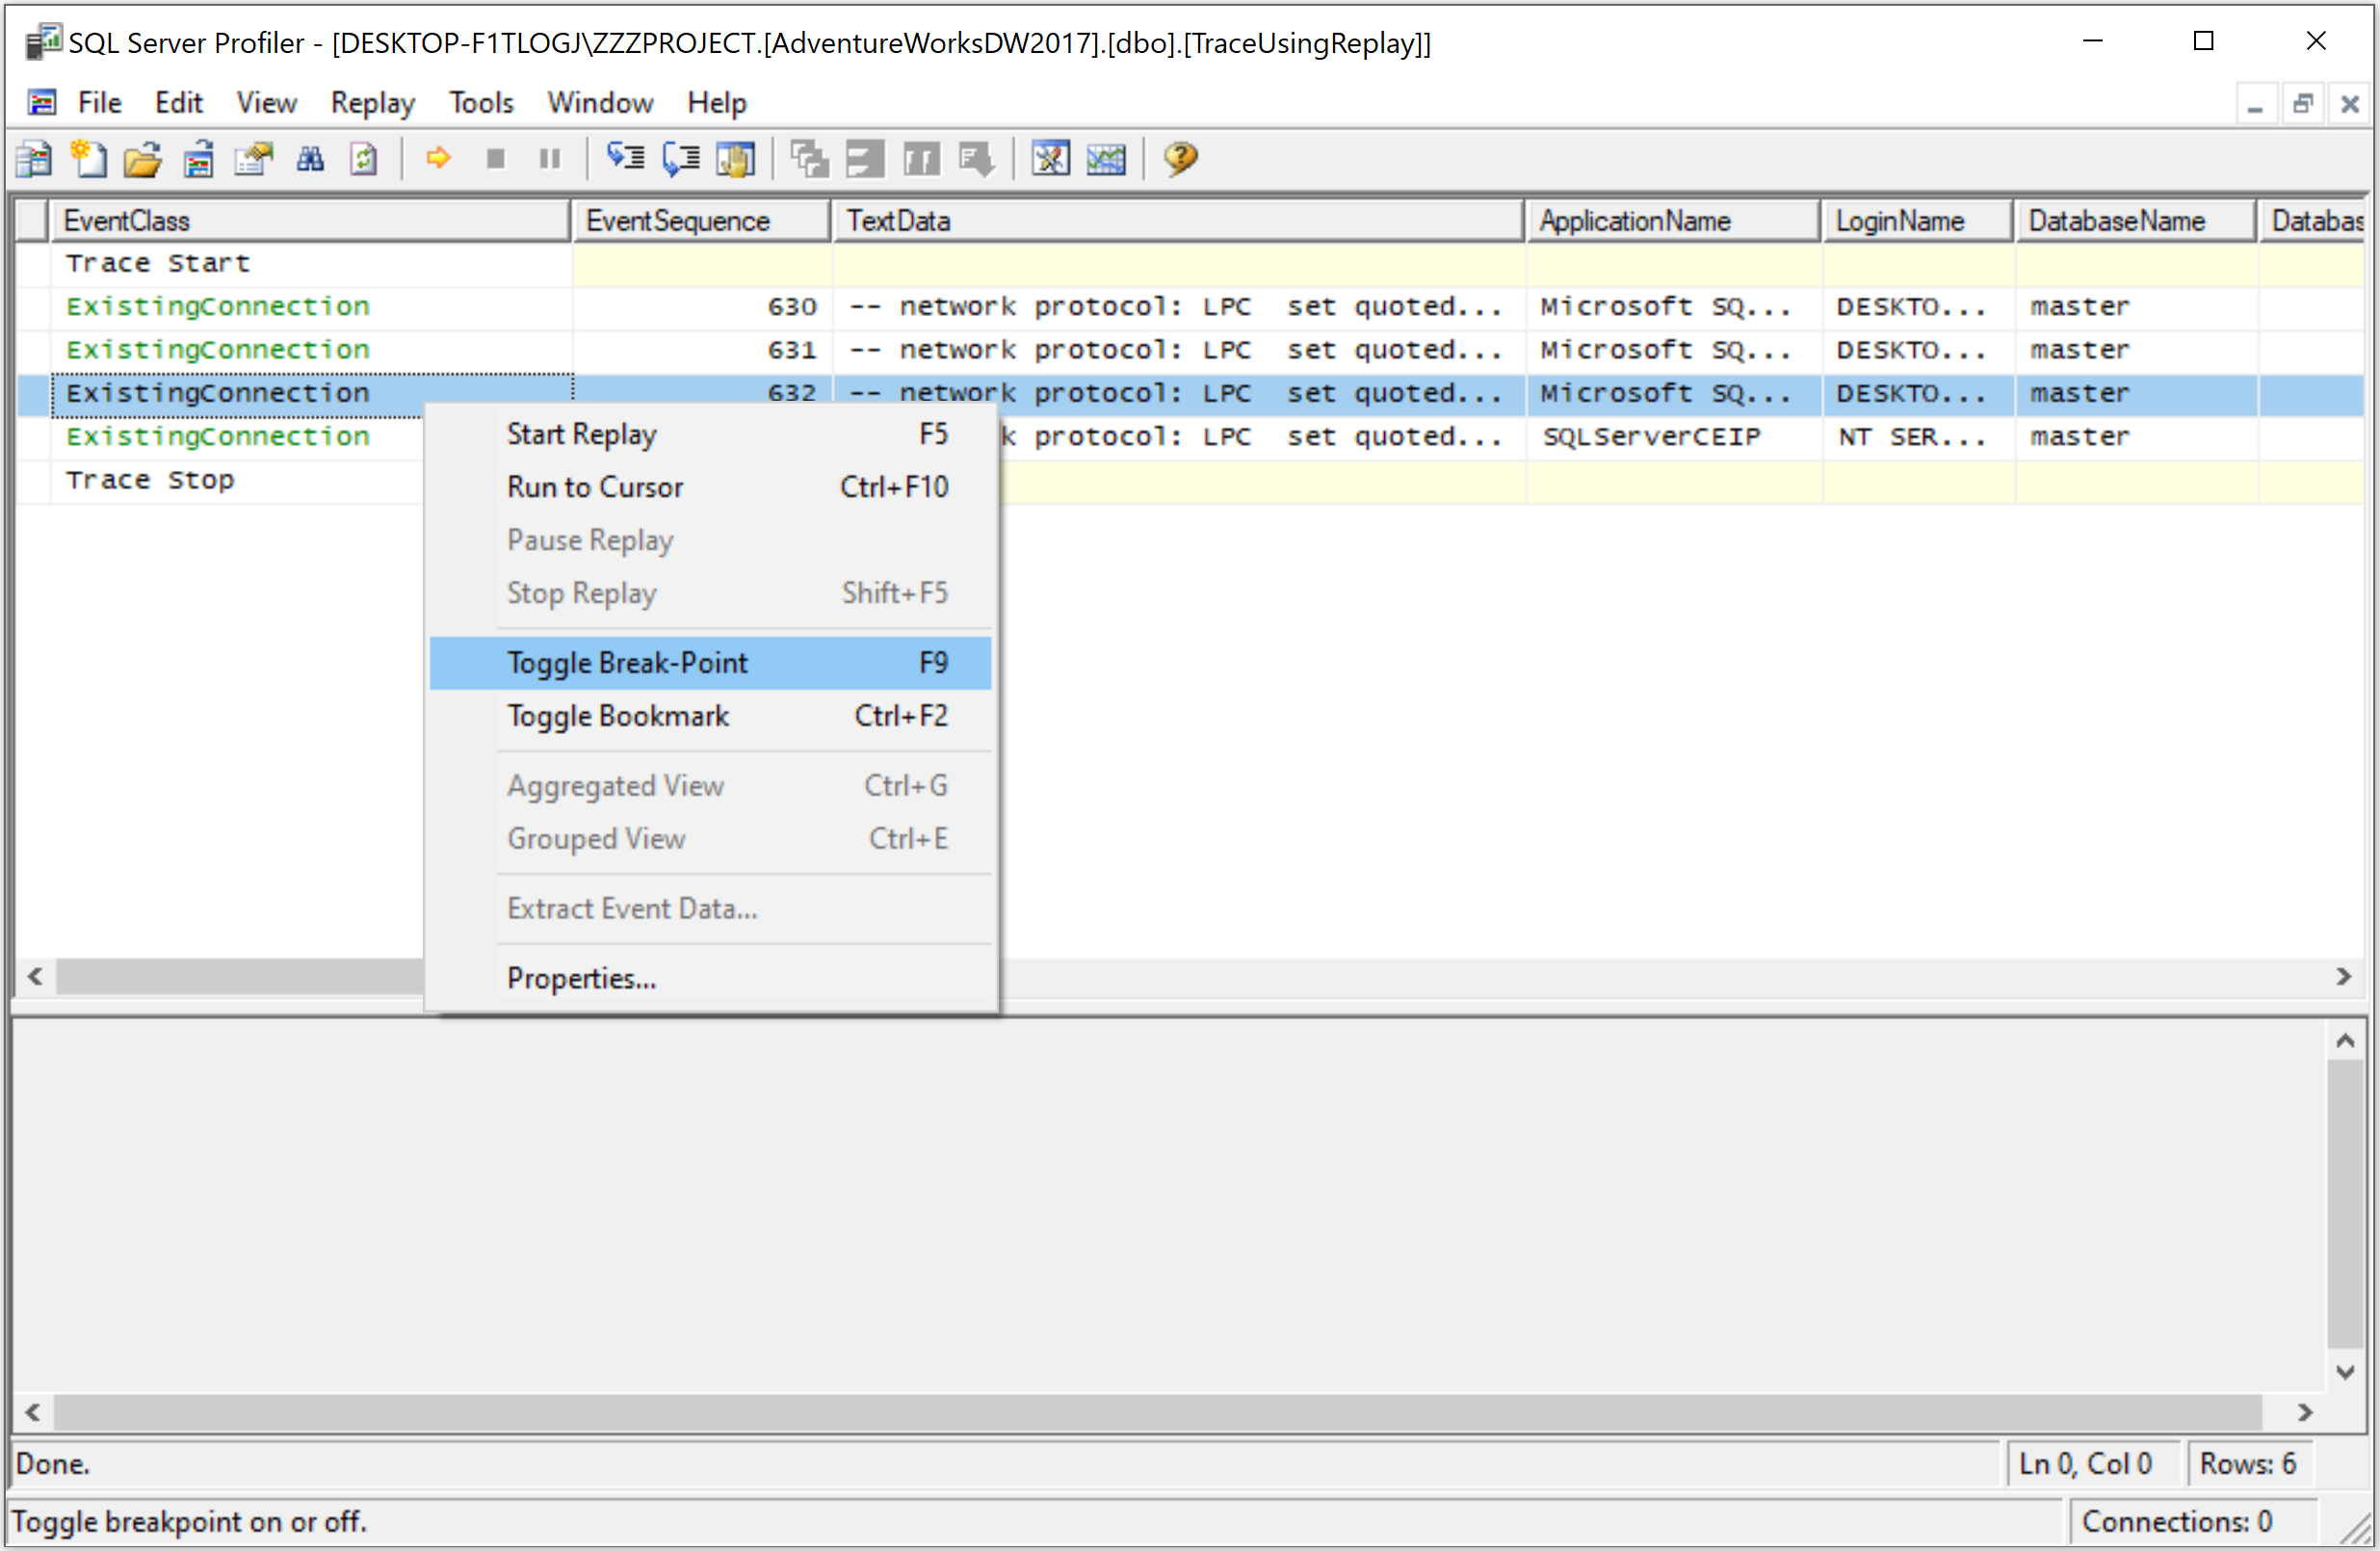
In the trace window, click an event that you want to use as a breakpoint using one of the following three methods to set a breakpoint.
- Press F9
- On the Replay menu, click Toggle Breakpoint
- Right-click the event, and then click Toggle Break-Point
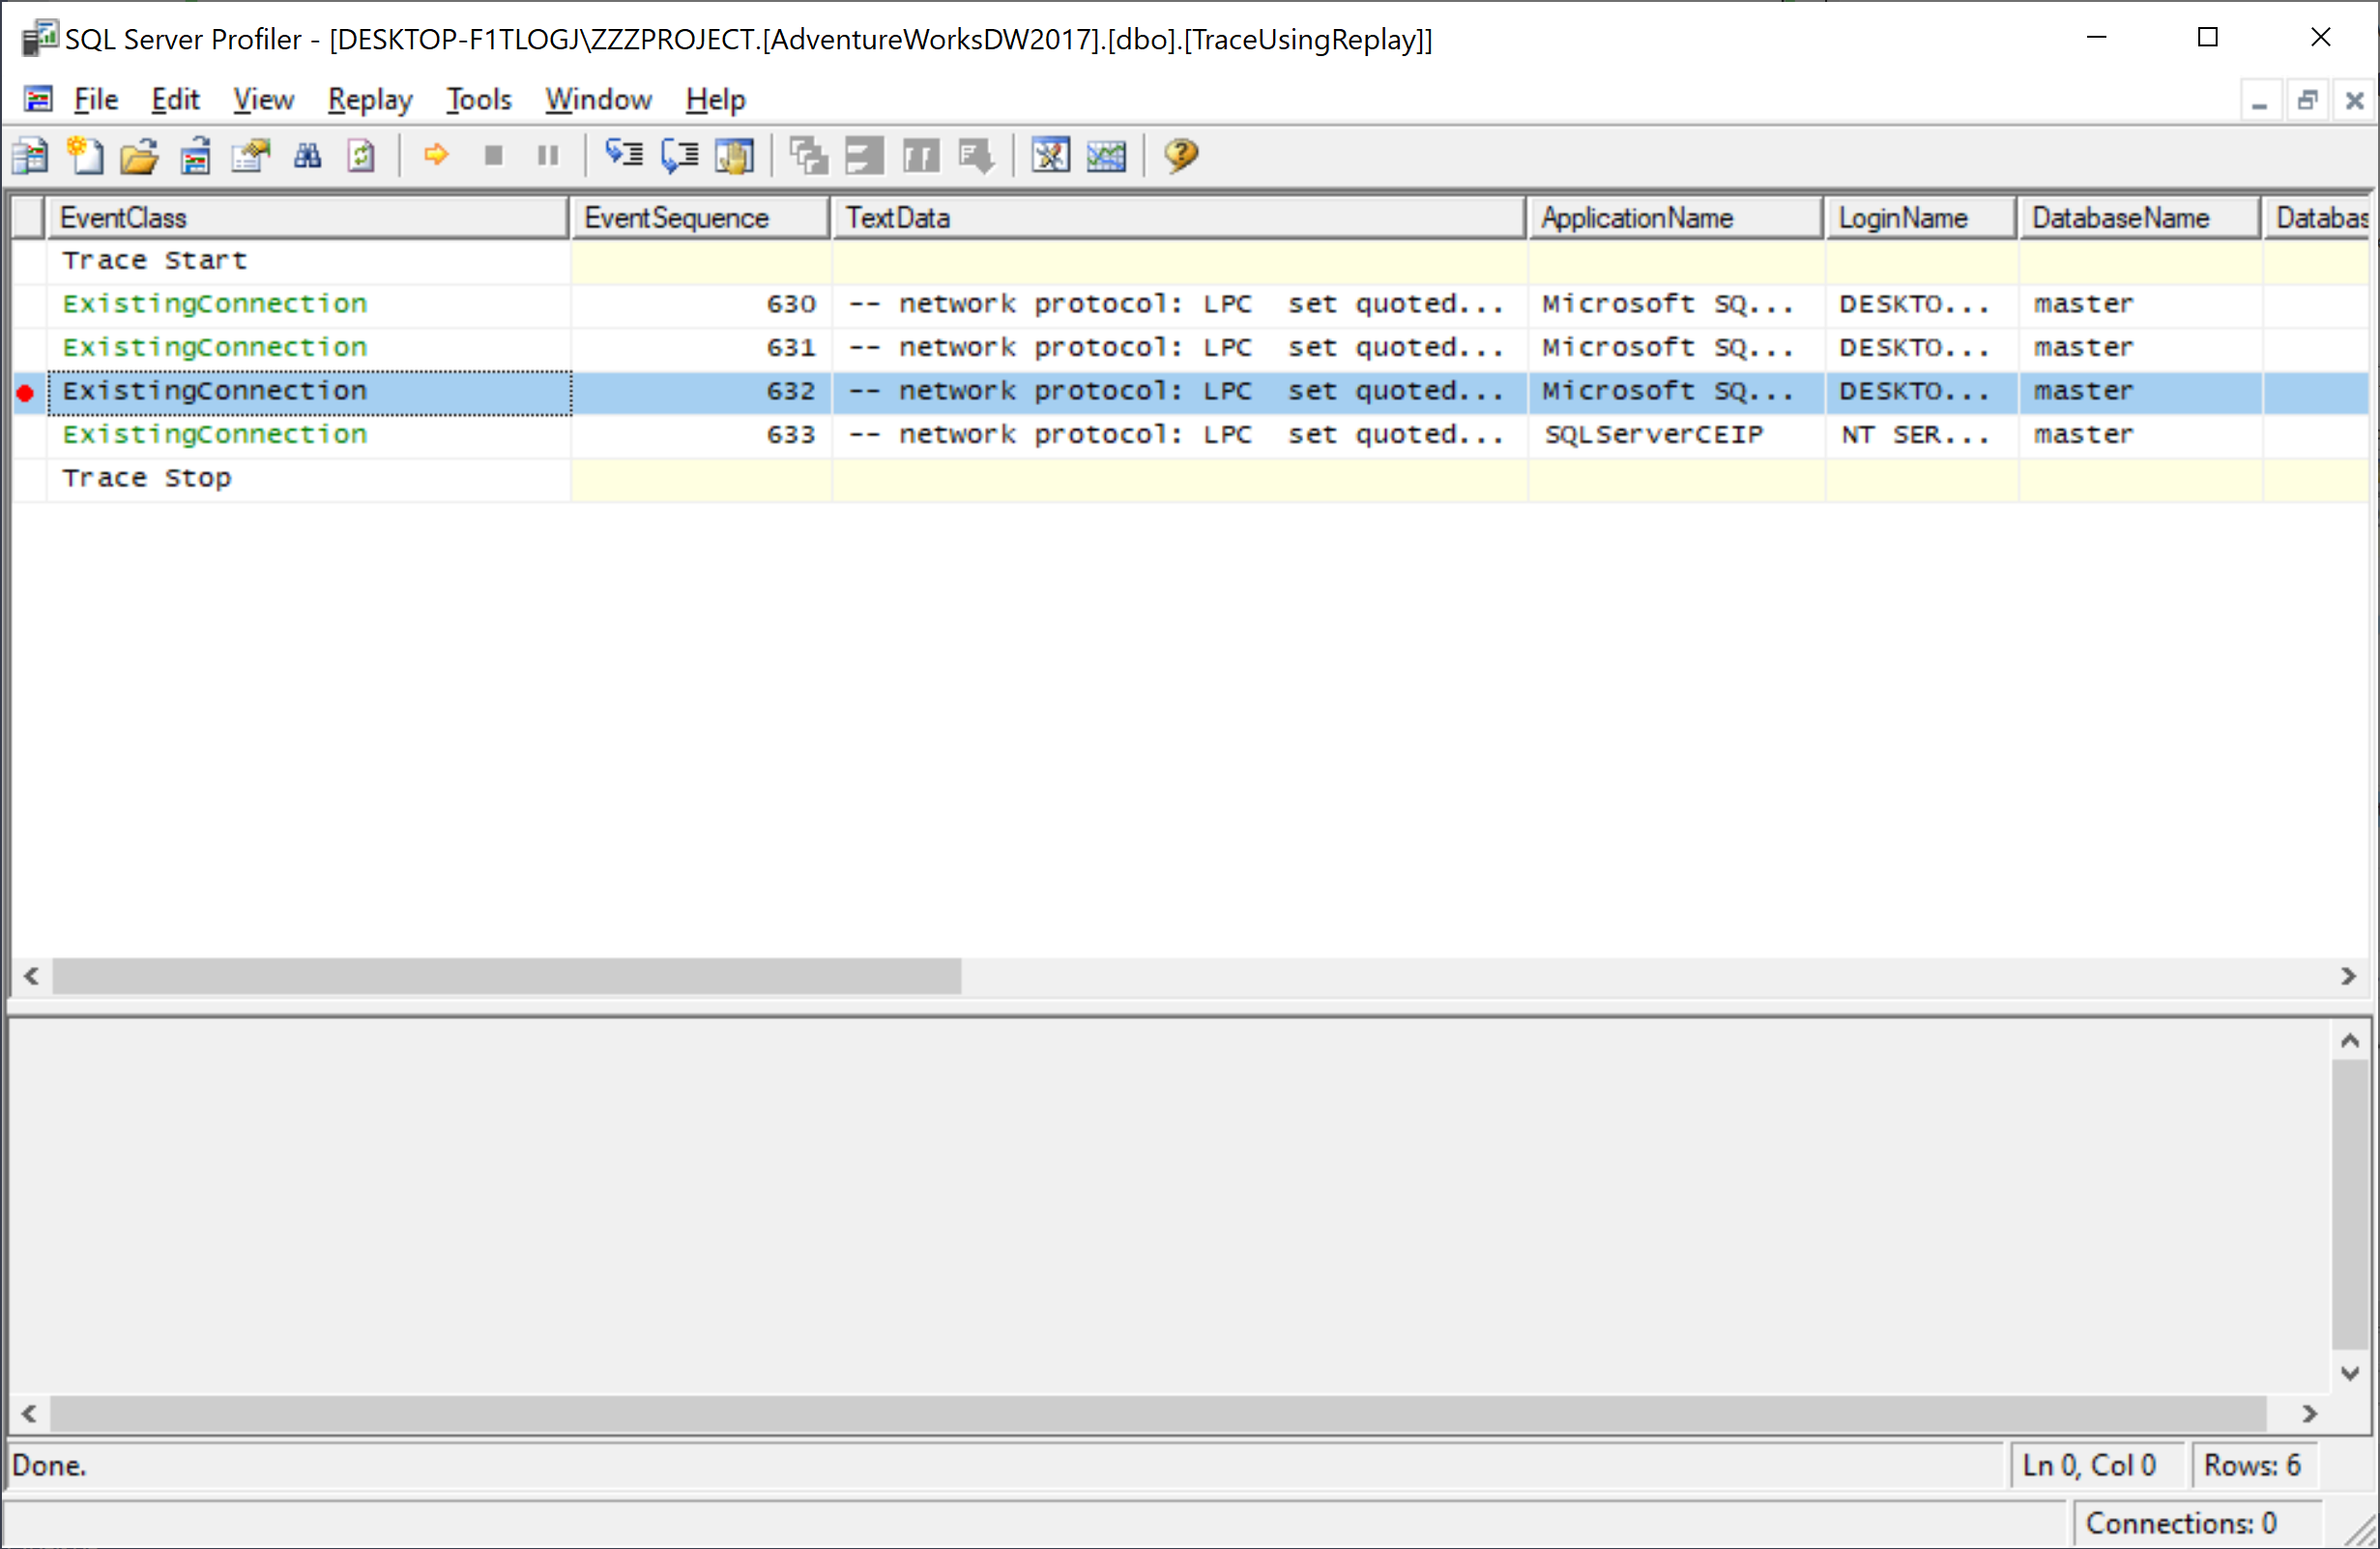
A red bullet appears next to the selected trace event, indicating that it is the trace breakpoint.
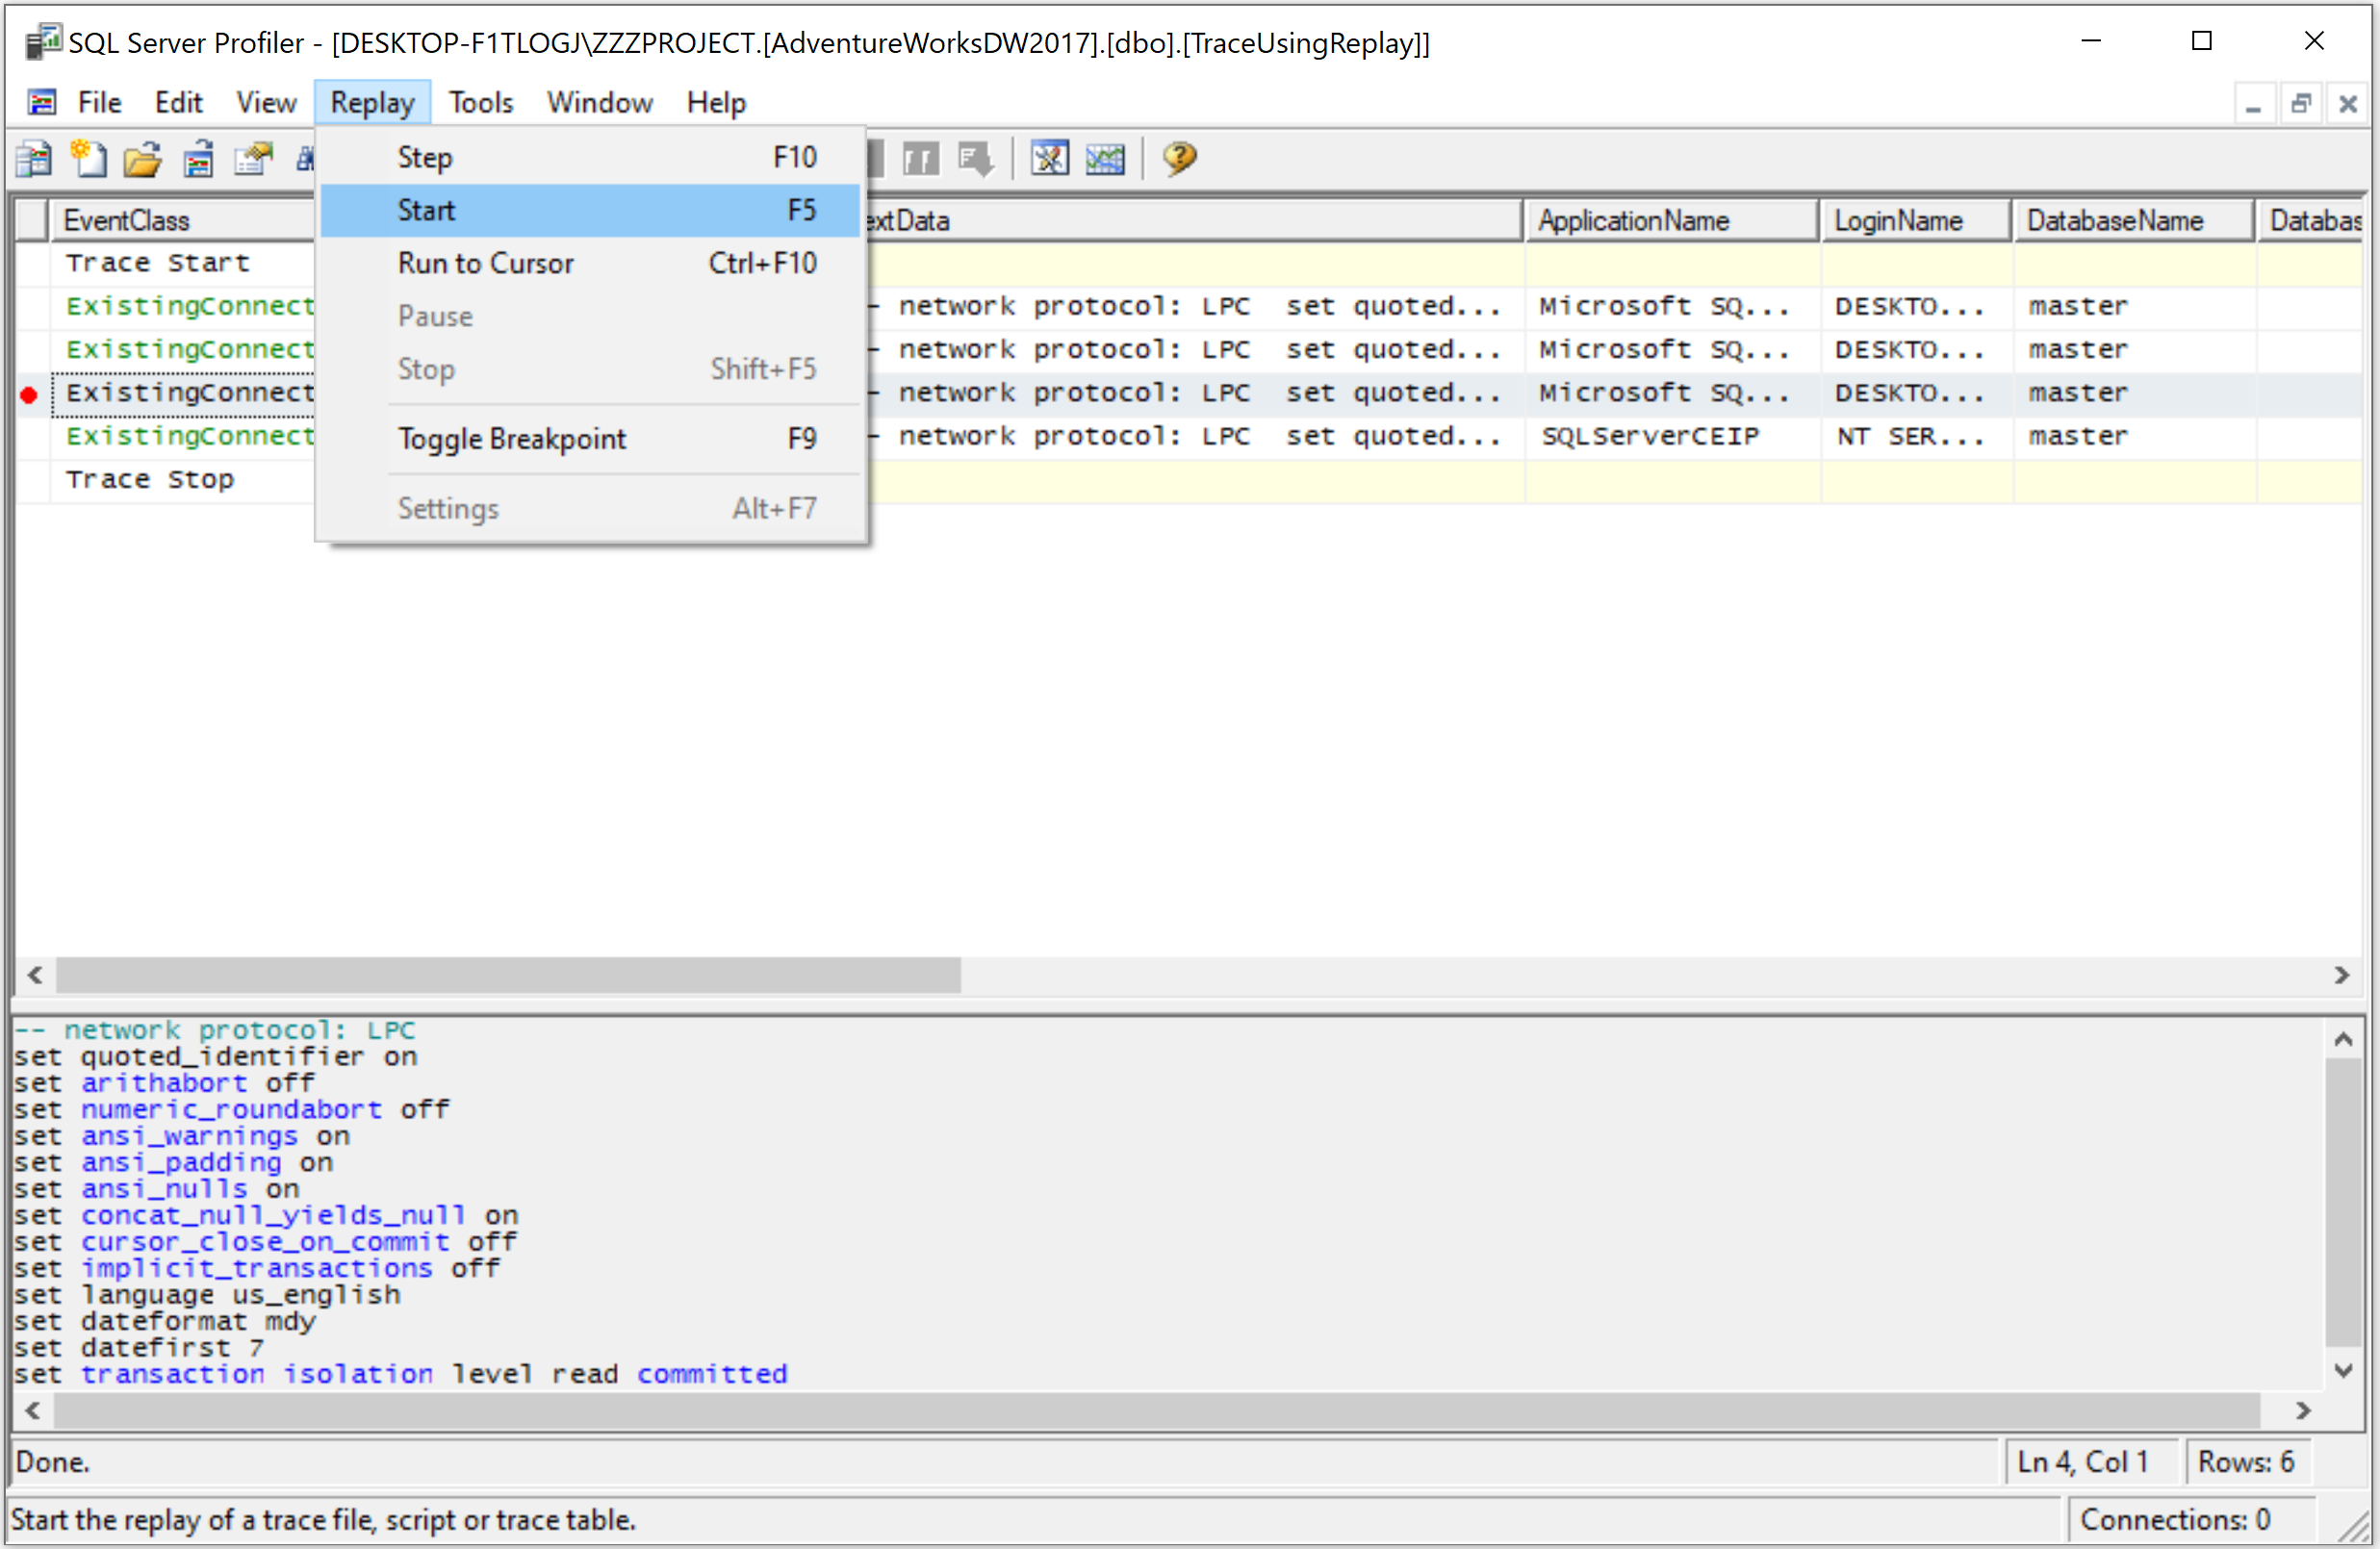
You can repeat this step to set several breakpoints. On the Replay menu, click Start, and connect to the server where you want to replay the trace.
Connect to an instance of SQL Server, and then in the Replay Configuration dialog, specify Replay server.
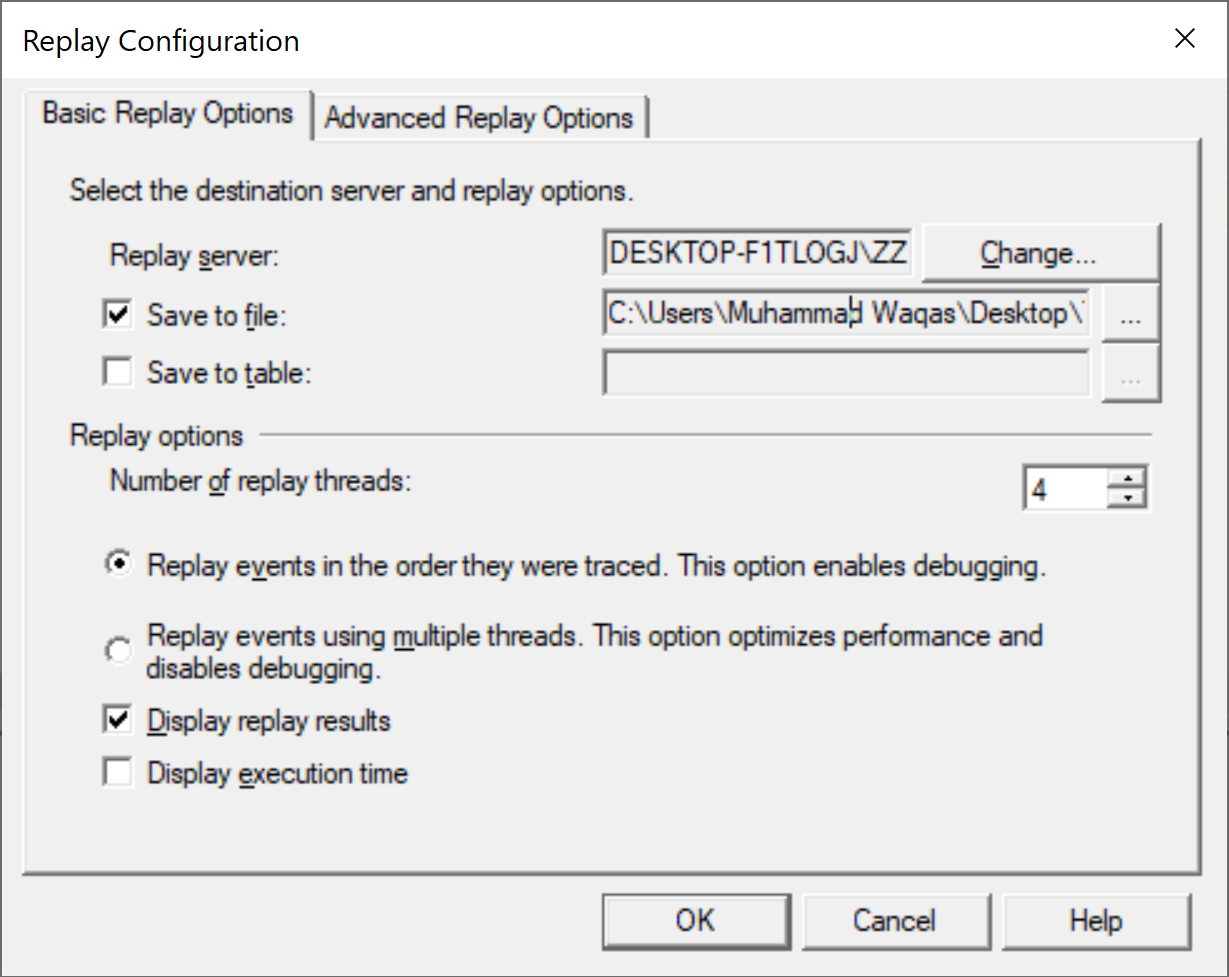
You can select one of the following destinations in which to save the replay:
- Save to file, which specifies a file in which to save the replay.
- Save to table, which specifies a database table in which to save the replay.
Select Save to file and option and specify the file, verify the settings, and then click the OK button.
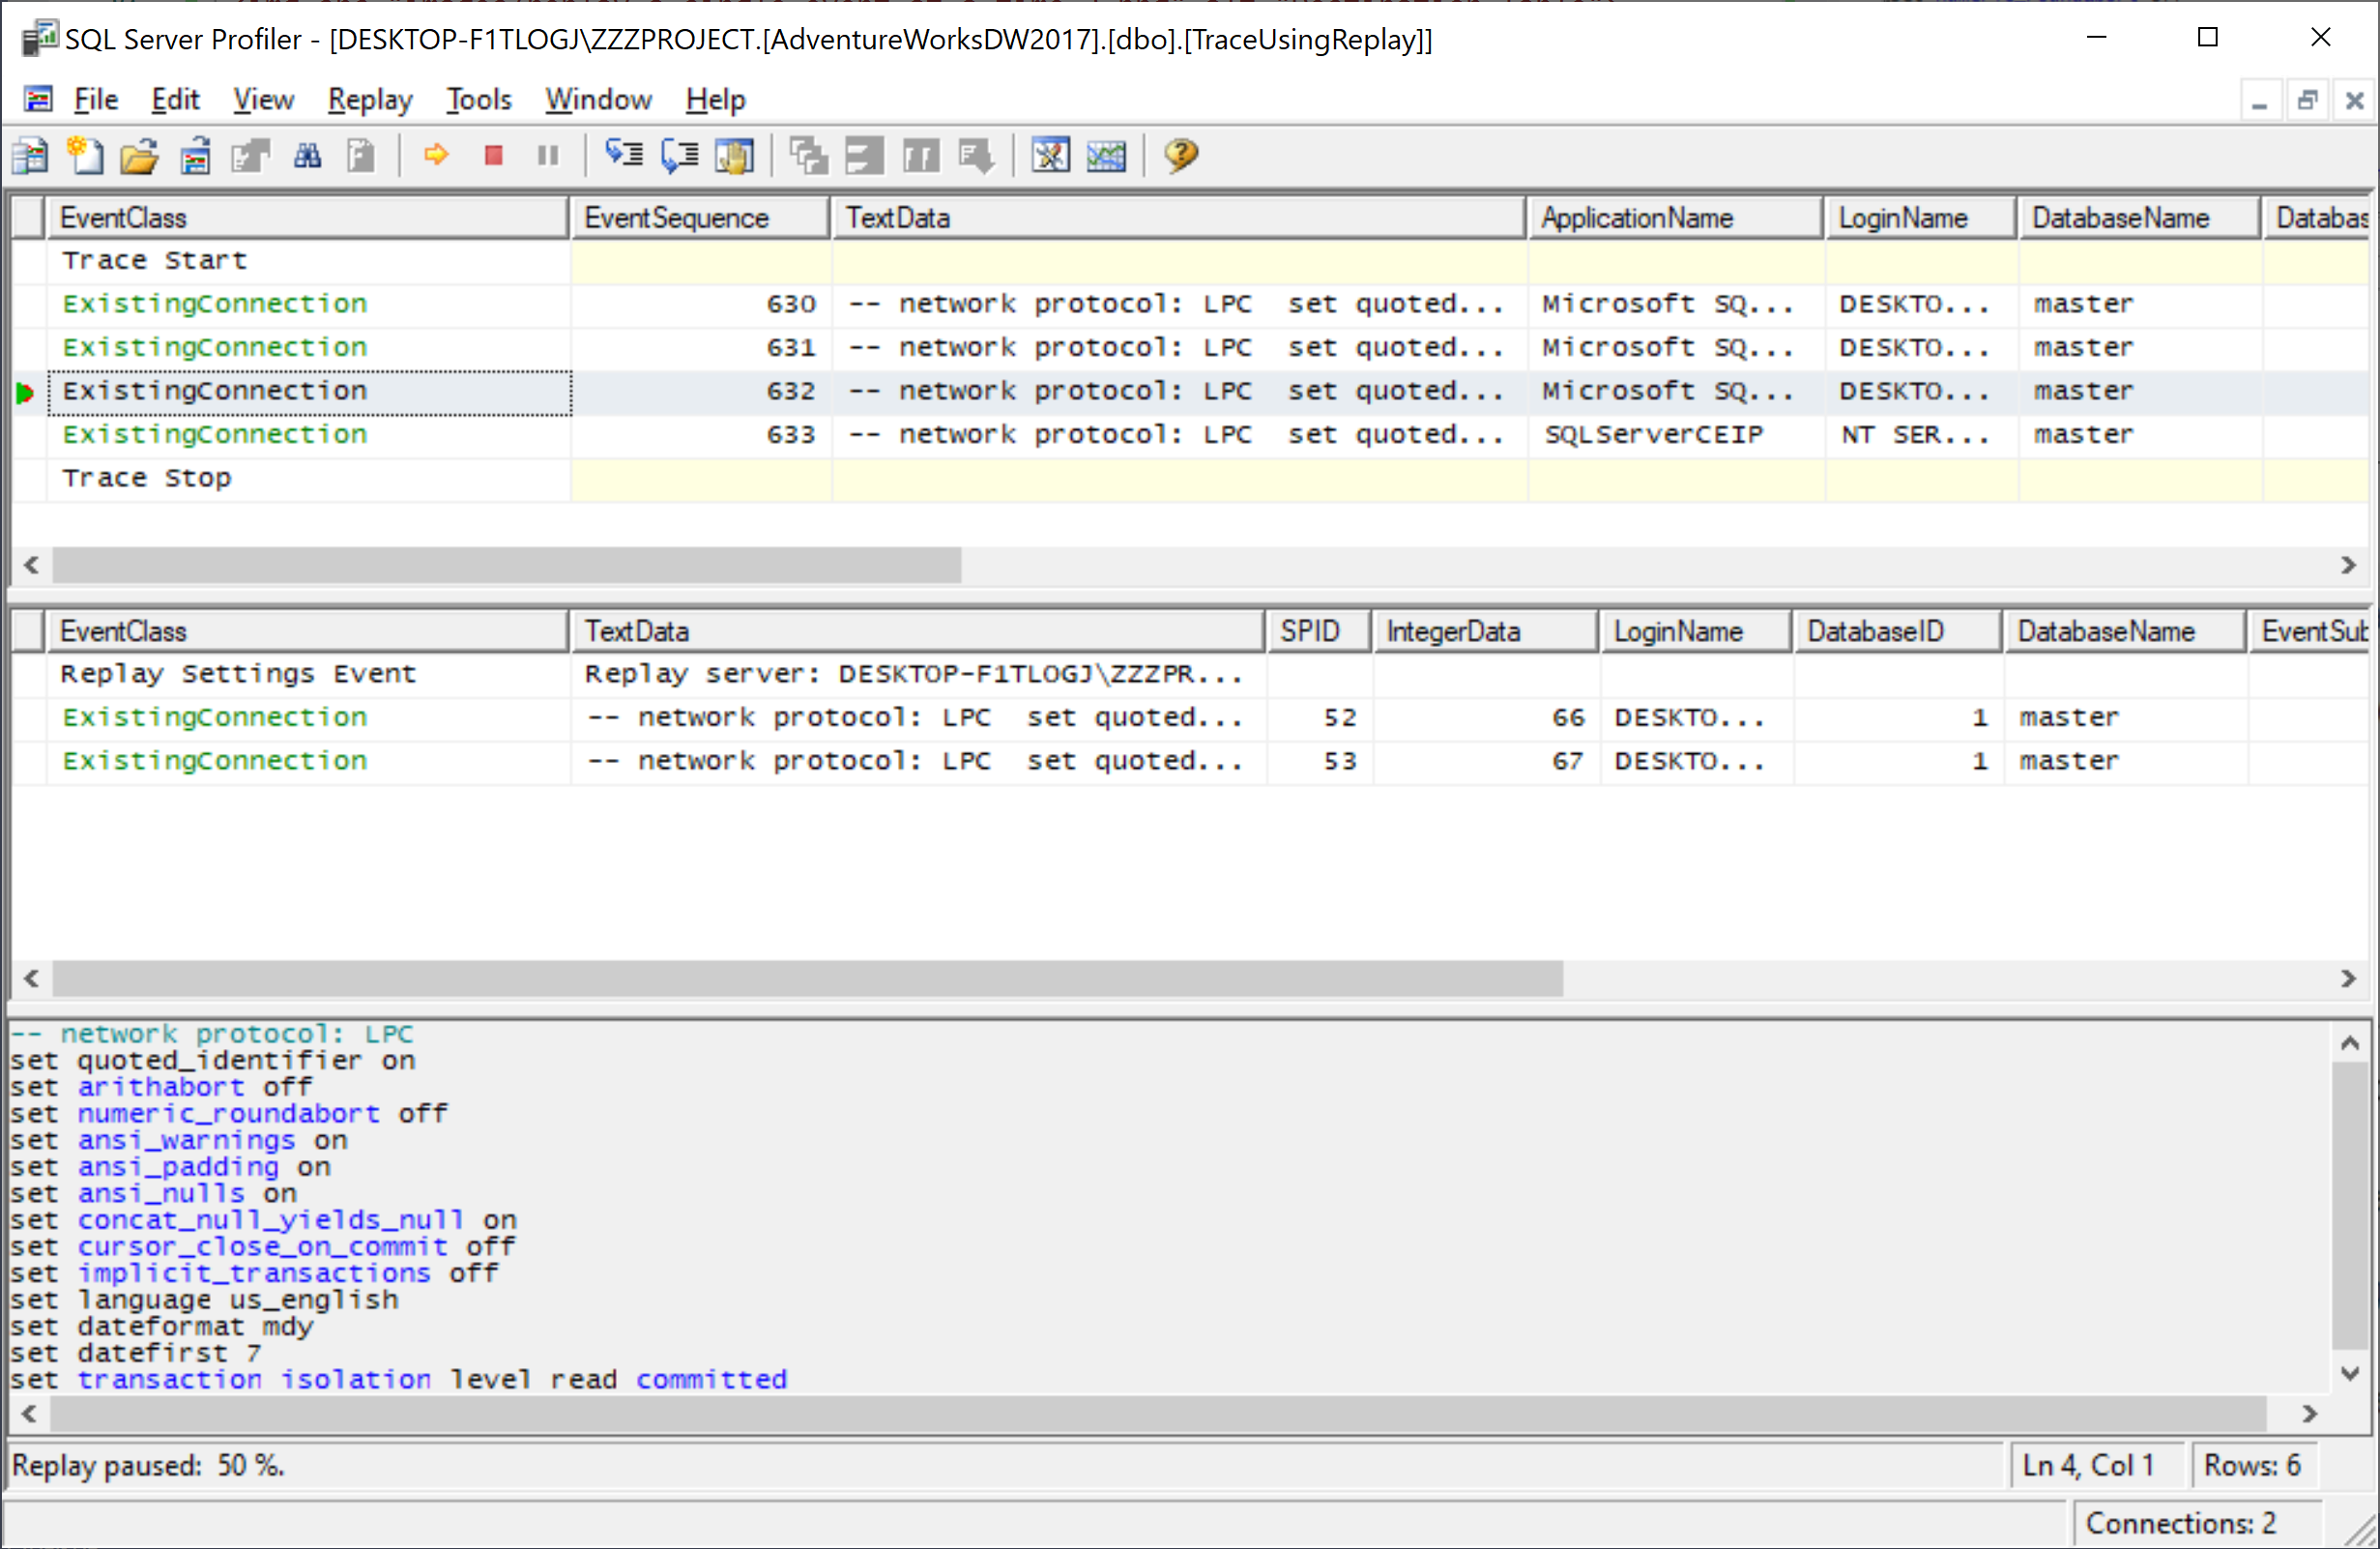
The replay starts, pausing when the breakpoint is reached. Press F5 to resume the replay and proceed to the next breakpoint or end of the trace if there is no other breakpoint available.
