SQL Server Profiler Replay a Trace Table
The ability to open and replay a previously saved trace is known as a replay. A multithreaded replay engine in SQL Server Profiler can simulate user connections and SQL Server Authentication. It is very helpful while troubleshooting an application.
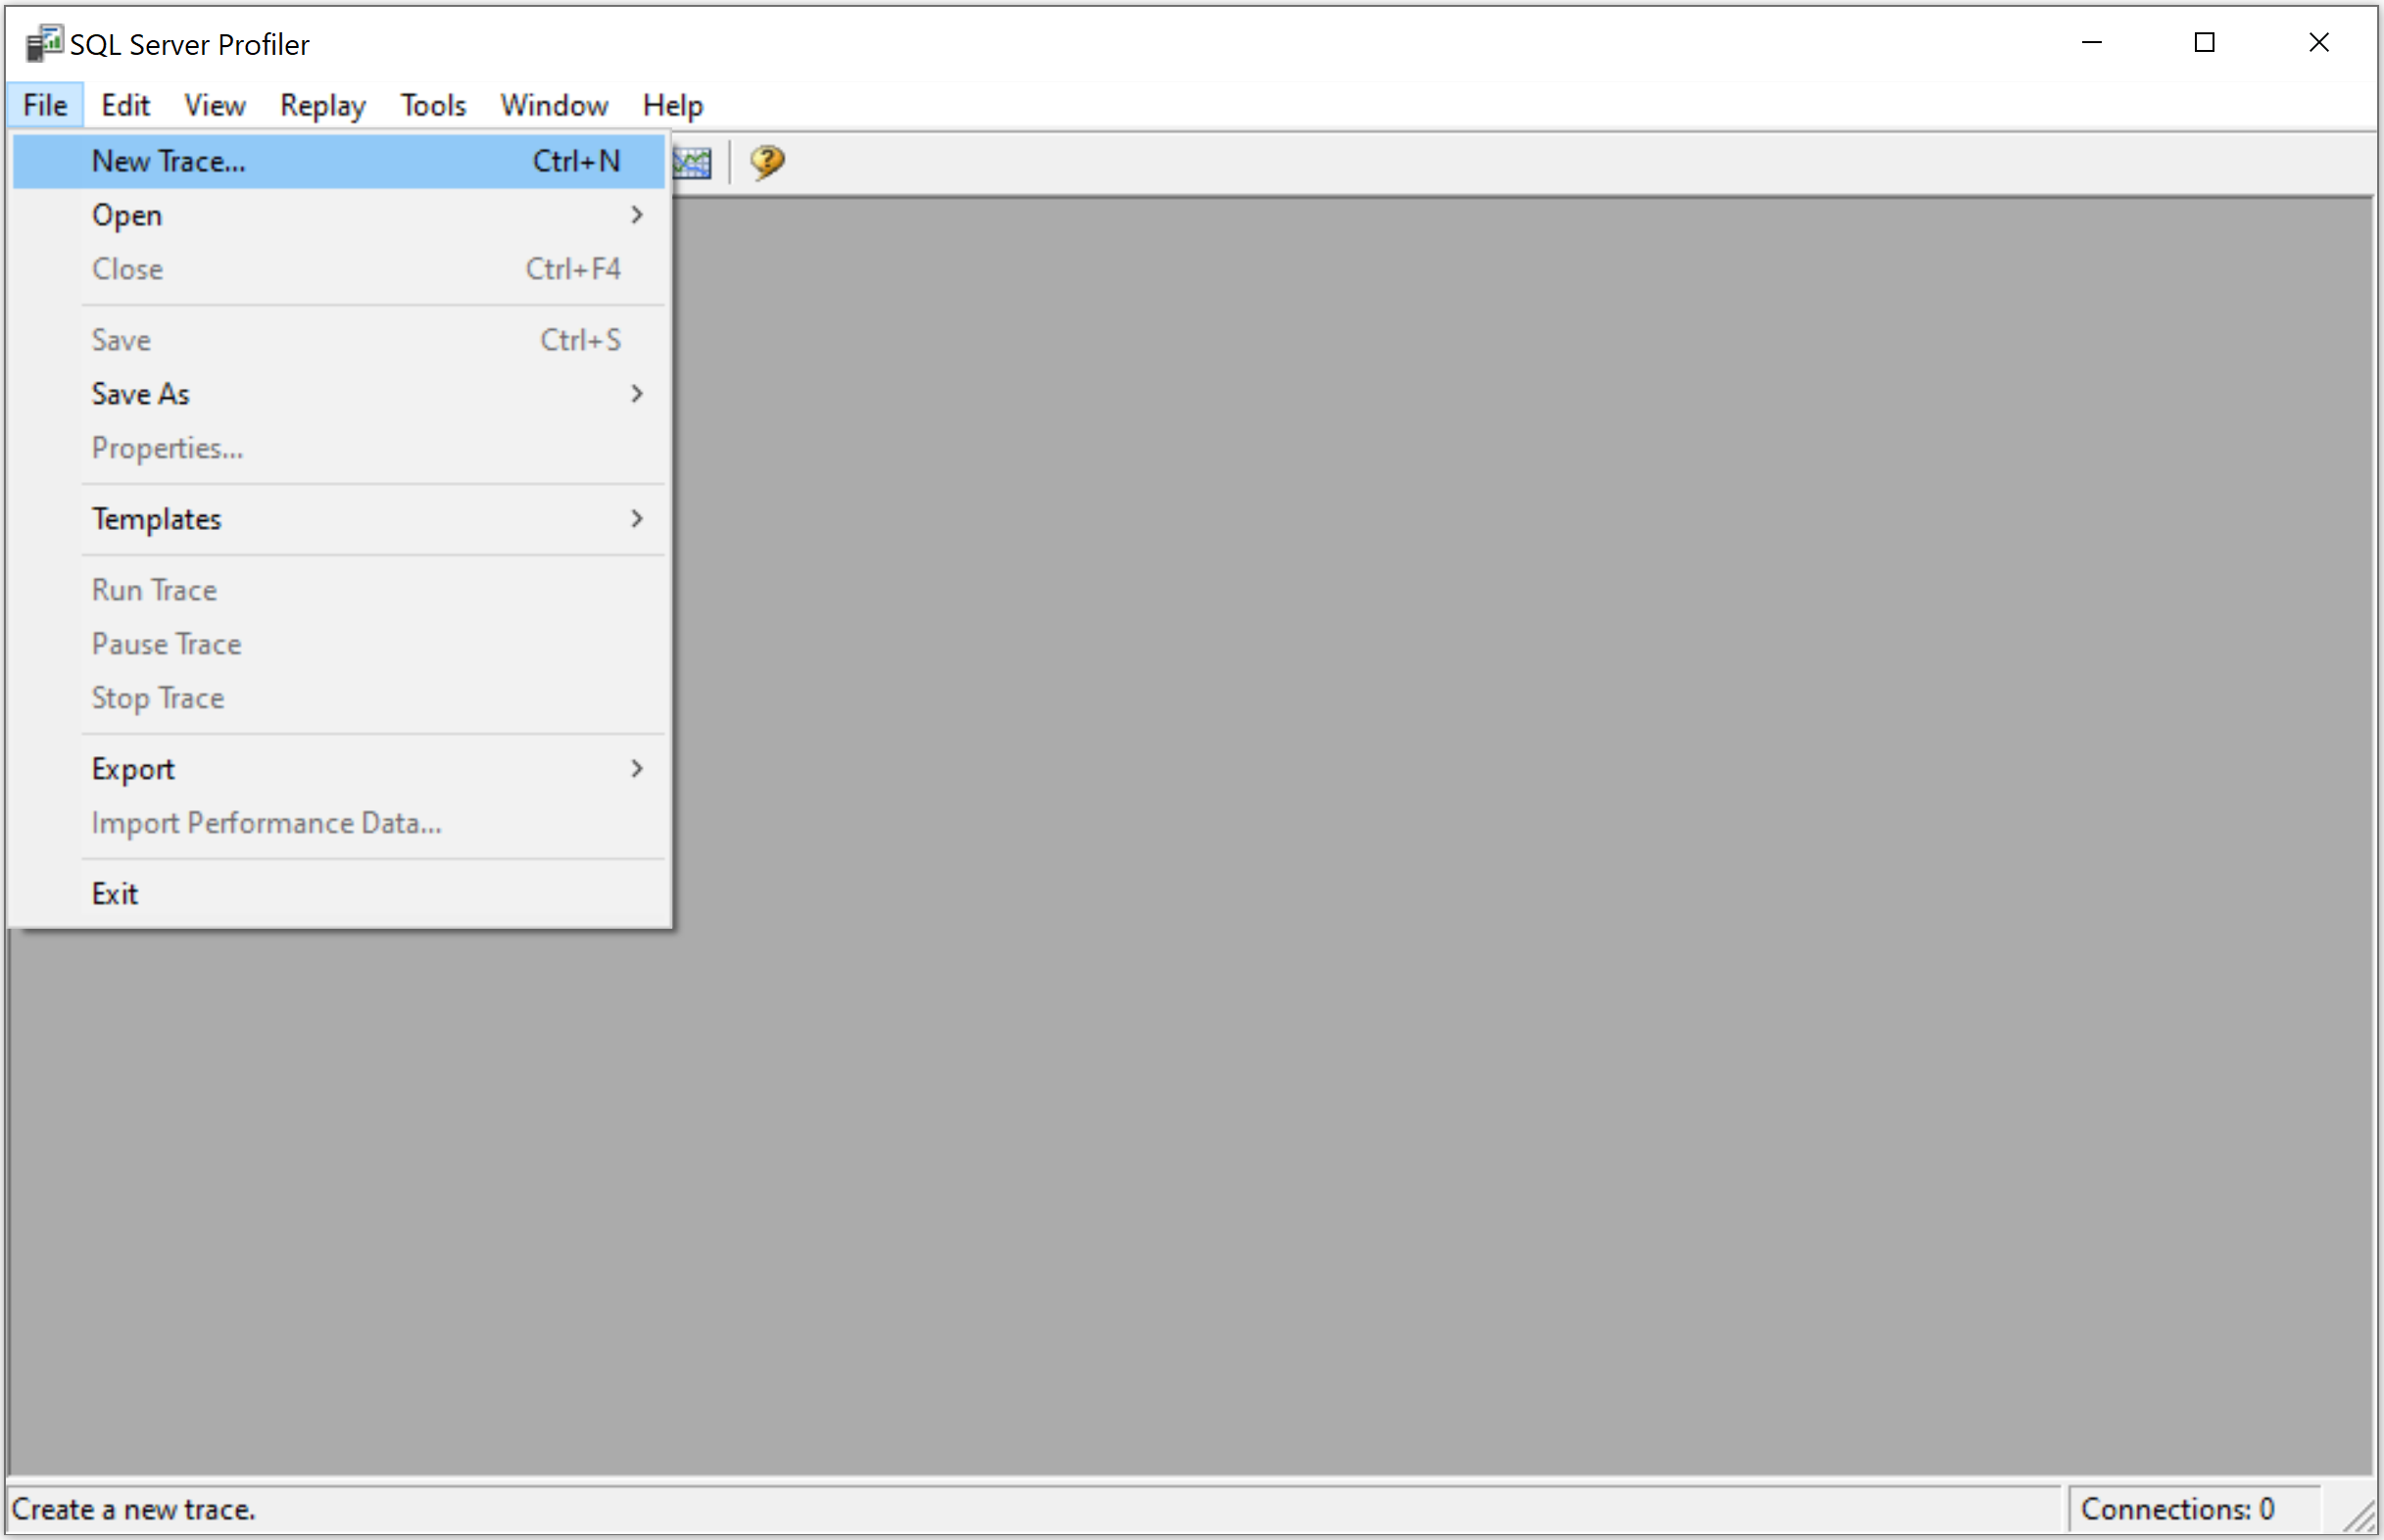
Let's open the SQL Server Profiler and go to the File > New Trace... menu.
It will open the Connect to Server dialog.
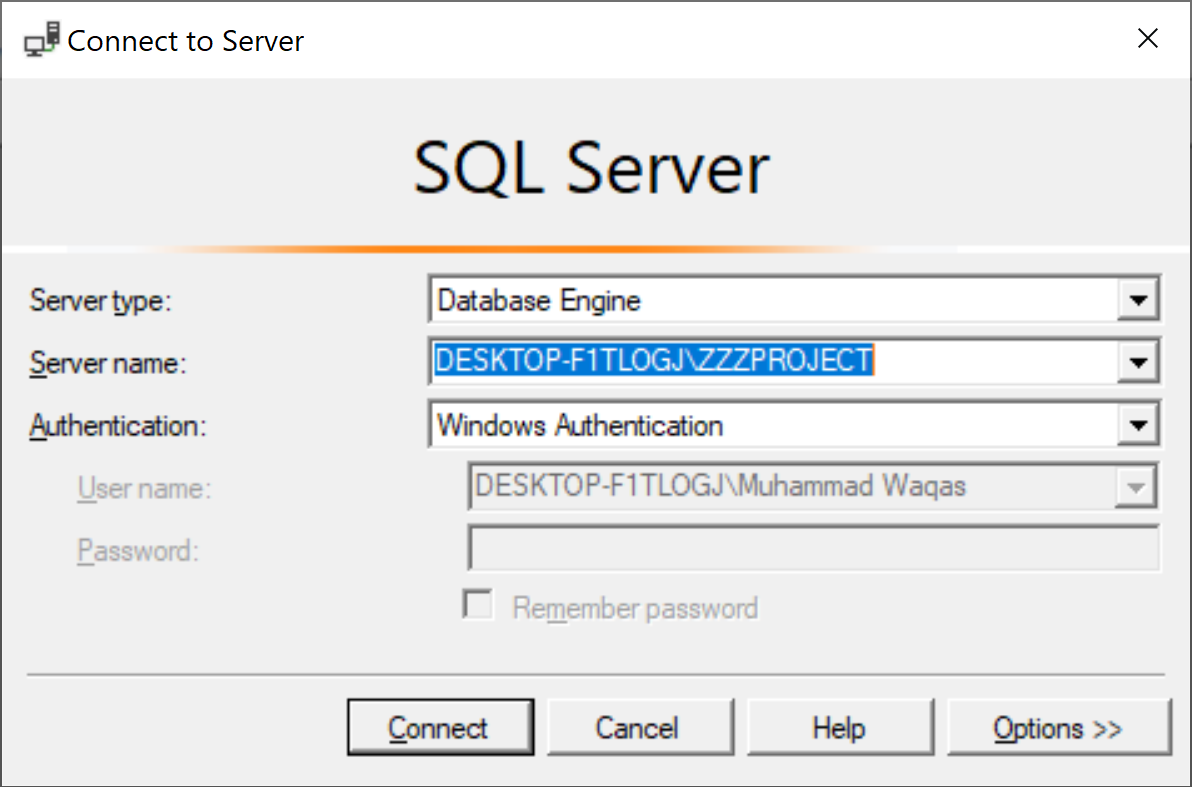
Click on the Connect button to connect to an instance of SQL Server and then it will open the Tace Properties dialog.
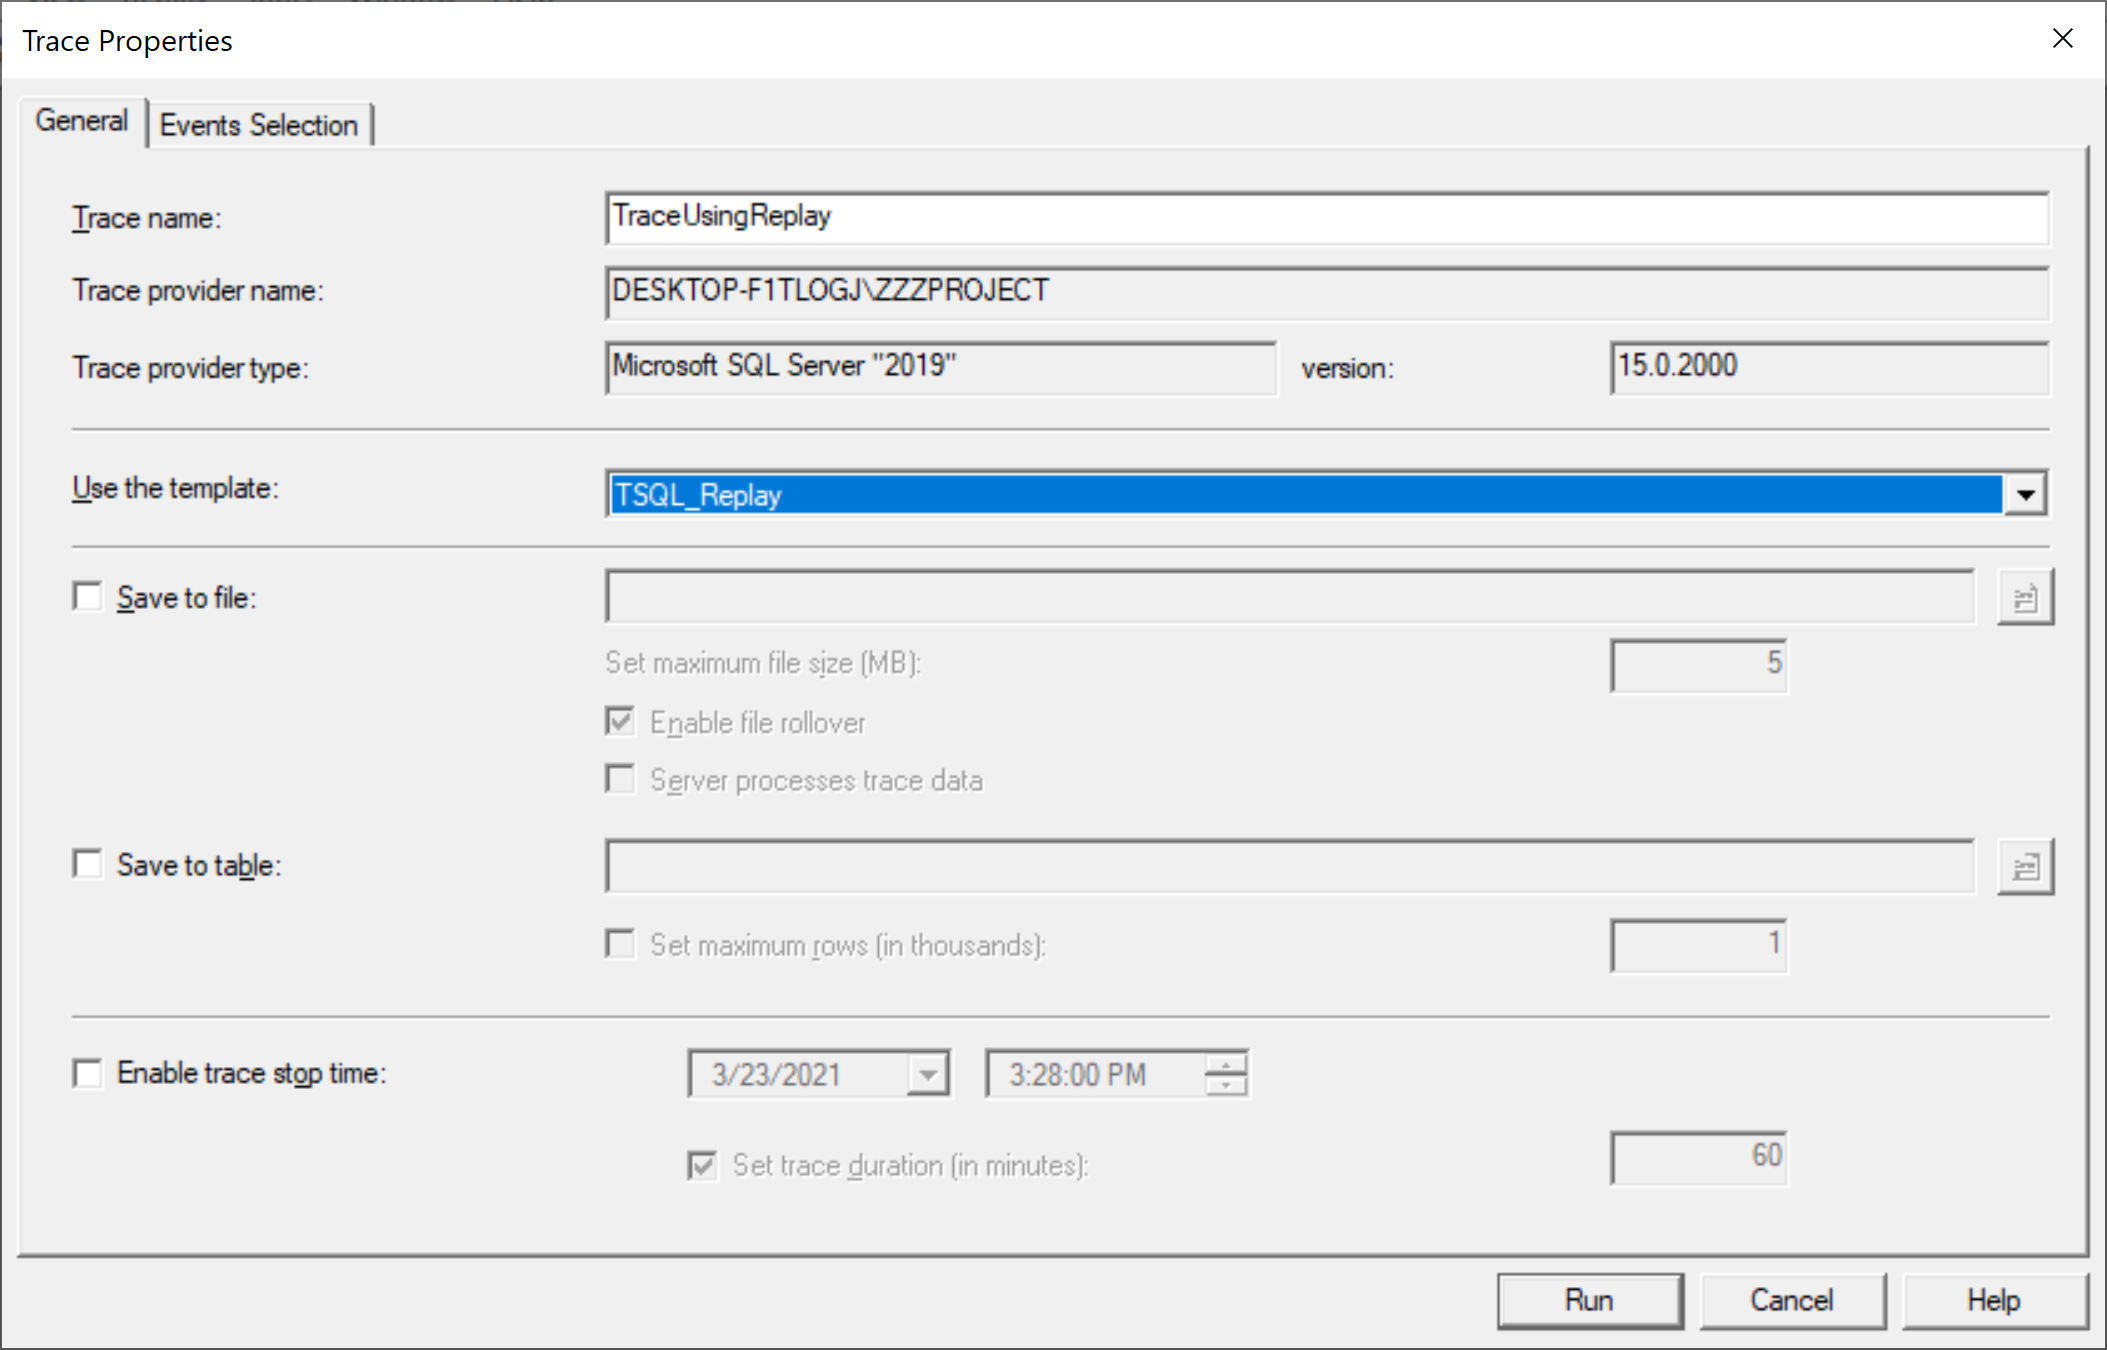
In the Trace name field, type a name for the trace, and in the Use the template list, select a TSQL_Replay template, choose the Save to table option, and connect to the server.
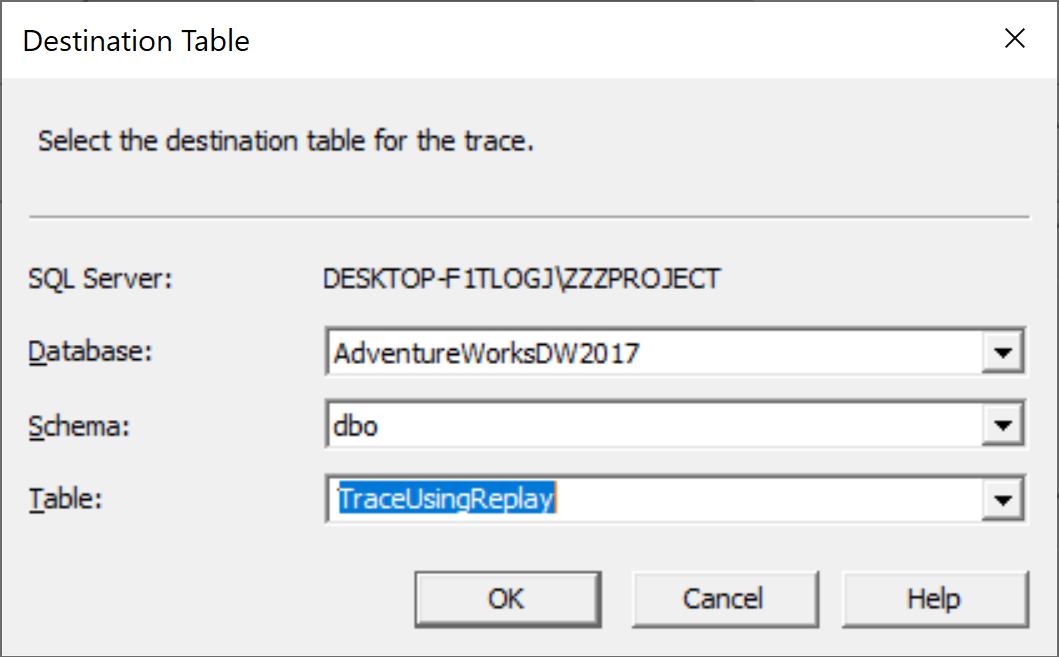
Select the destination table and click the OK button.
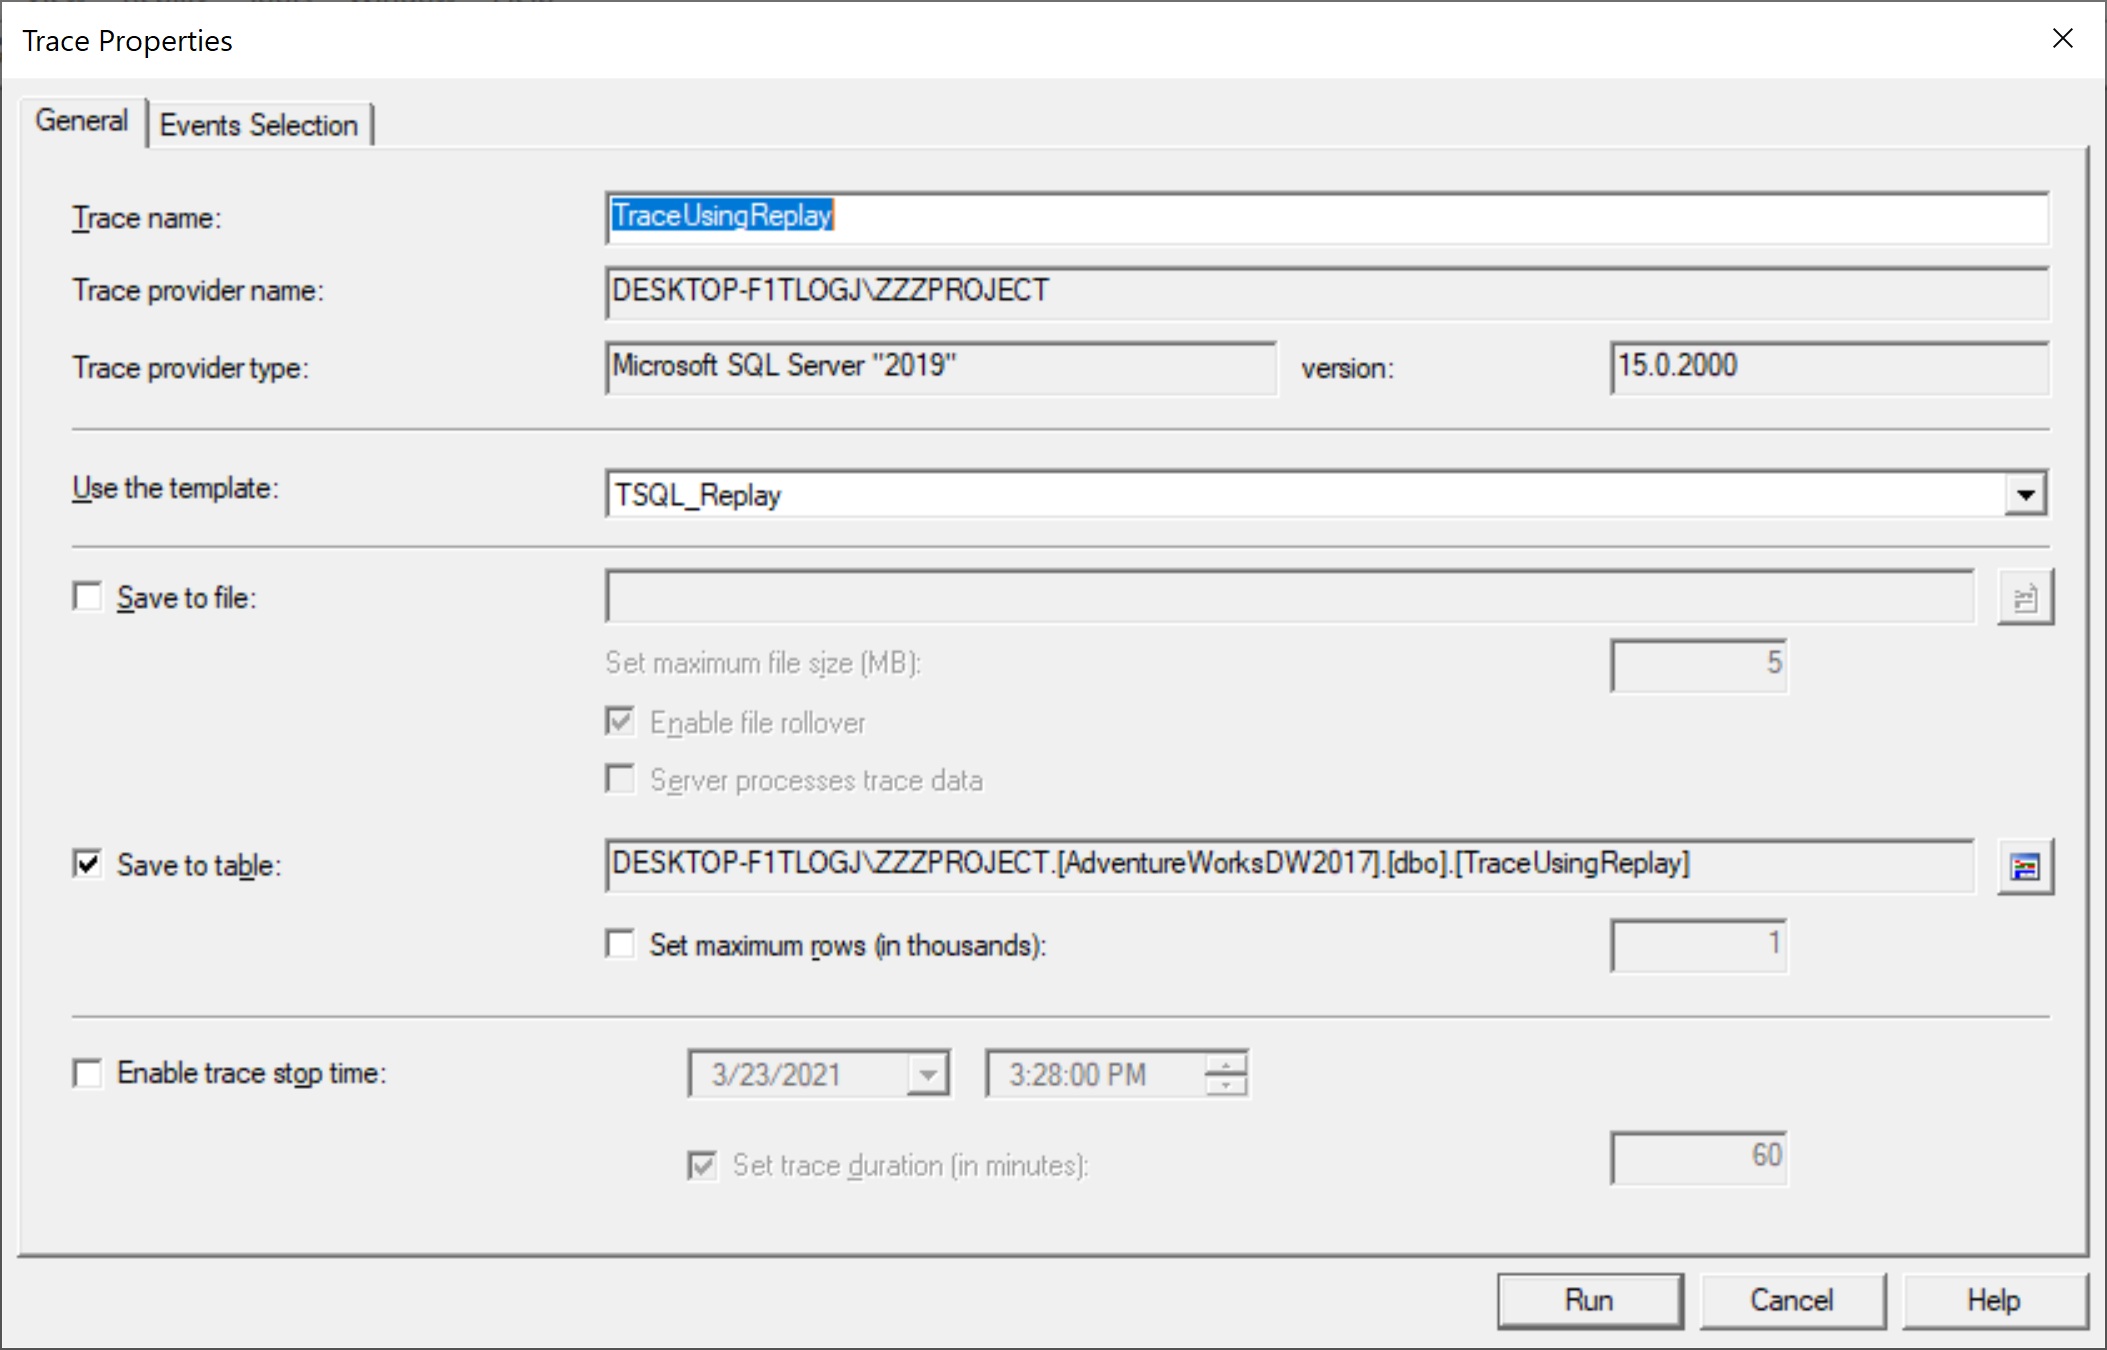
Let's review the Events Selection tab.
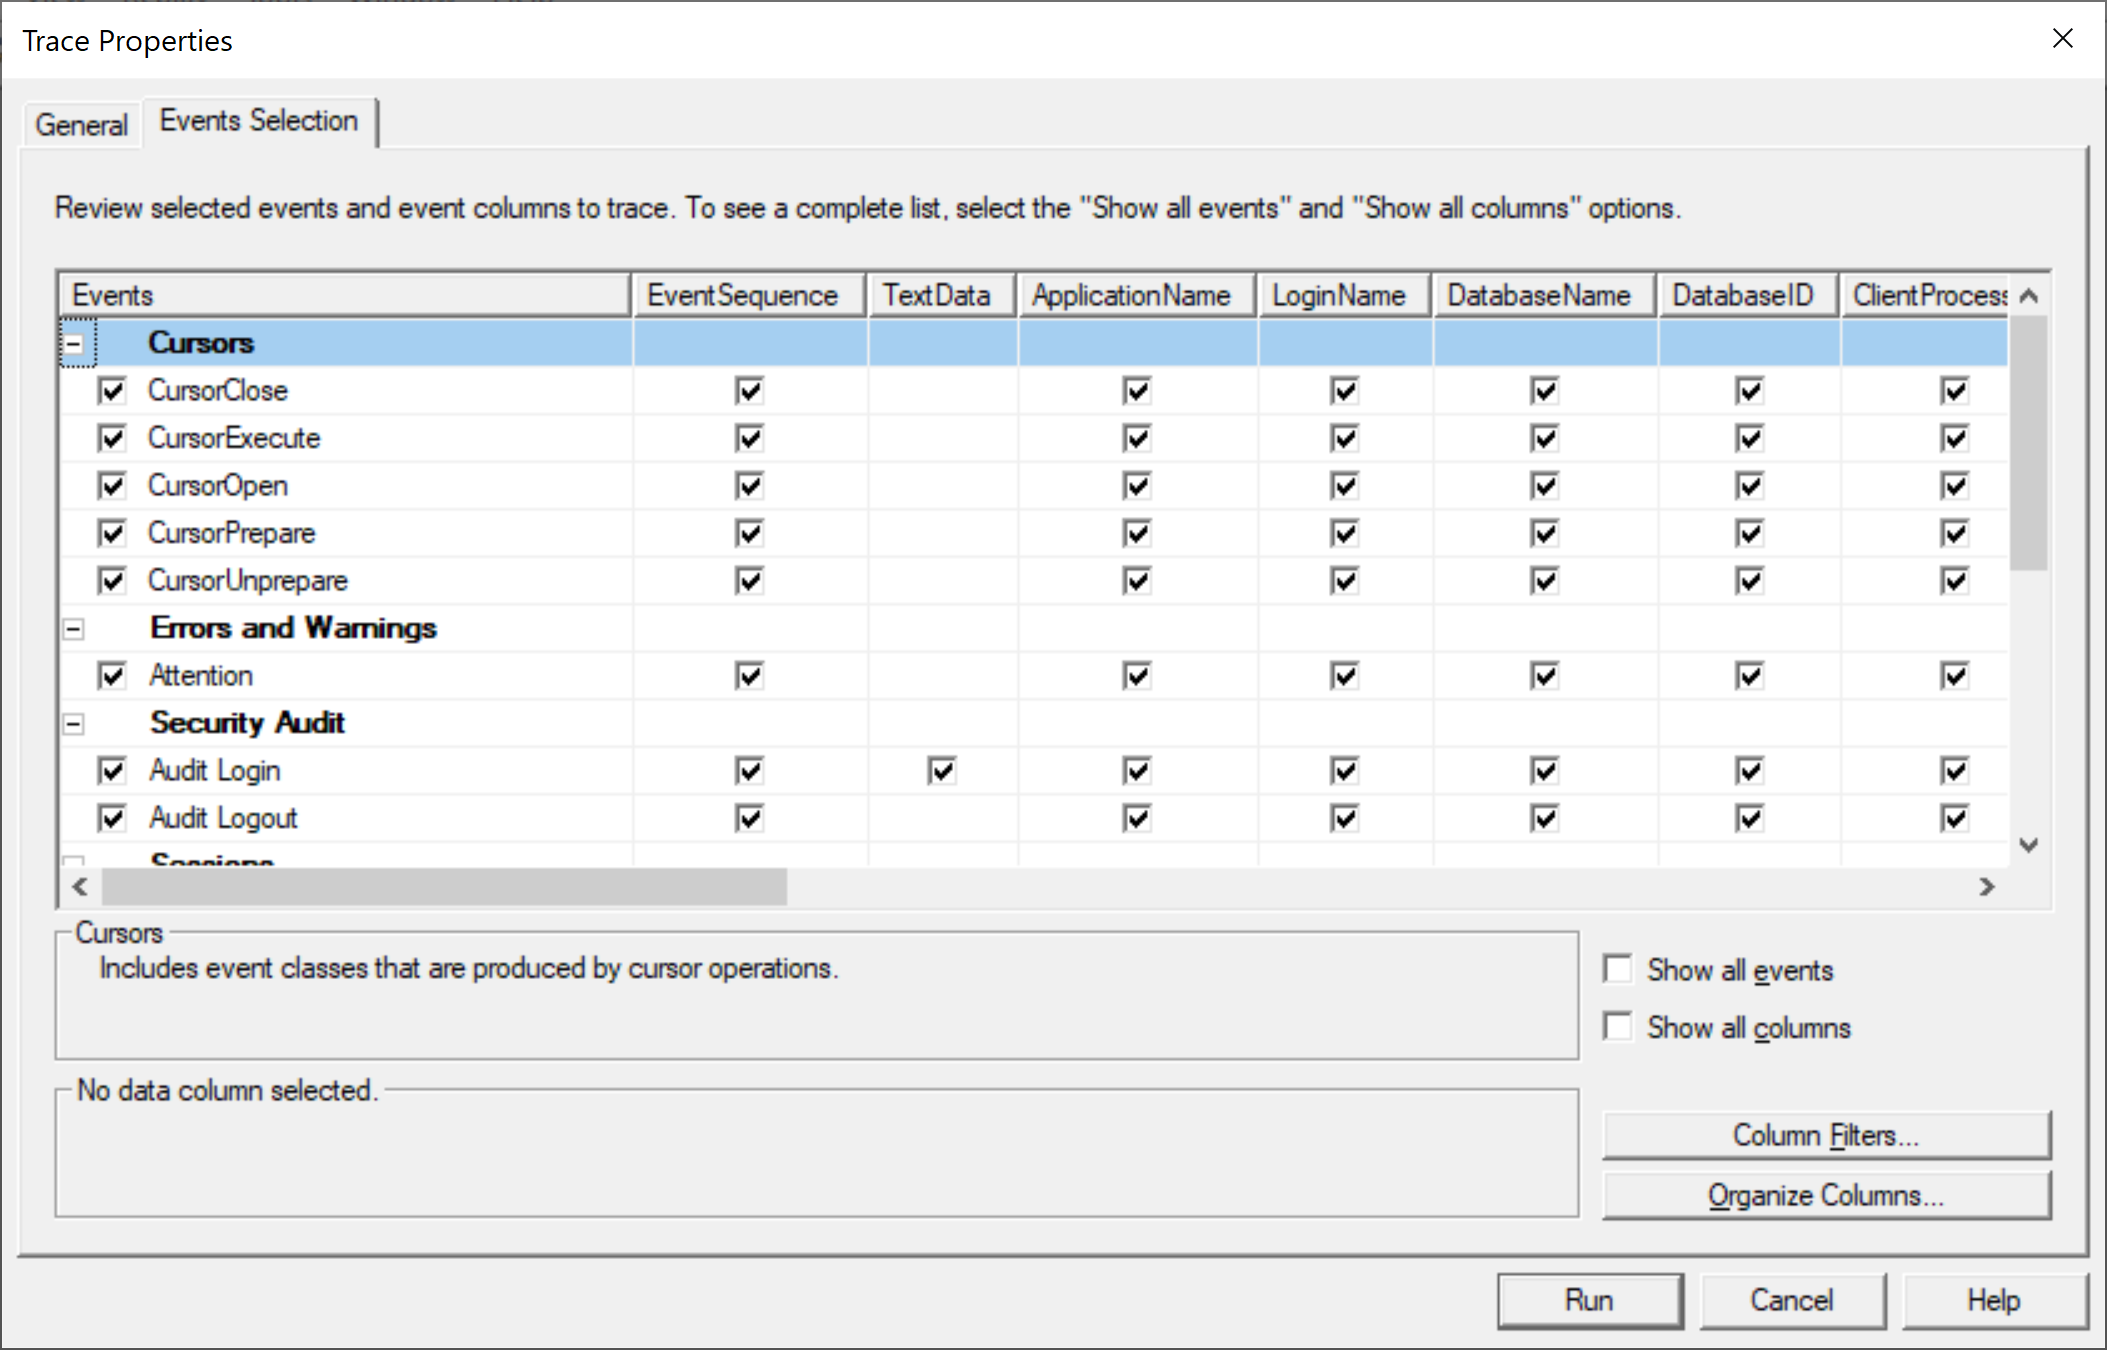
You will see the required events classes for Replay. Now run the trace by clicking on the Run button and then open a query editor and execute a simple query.
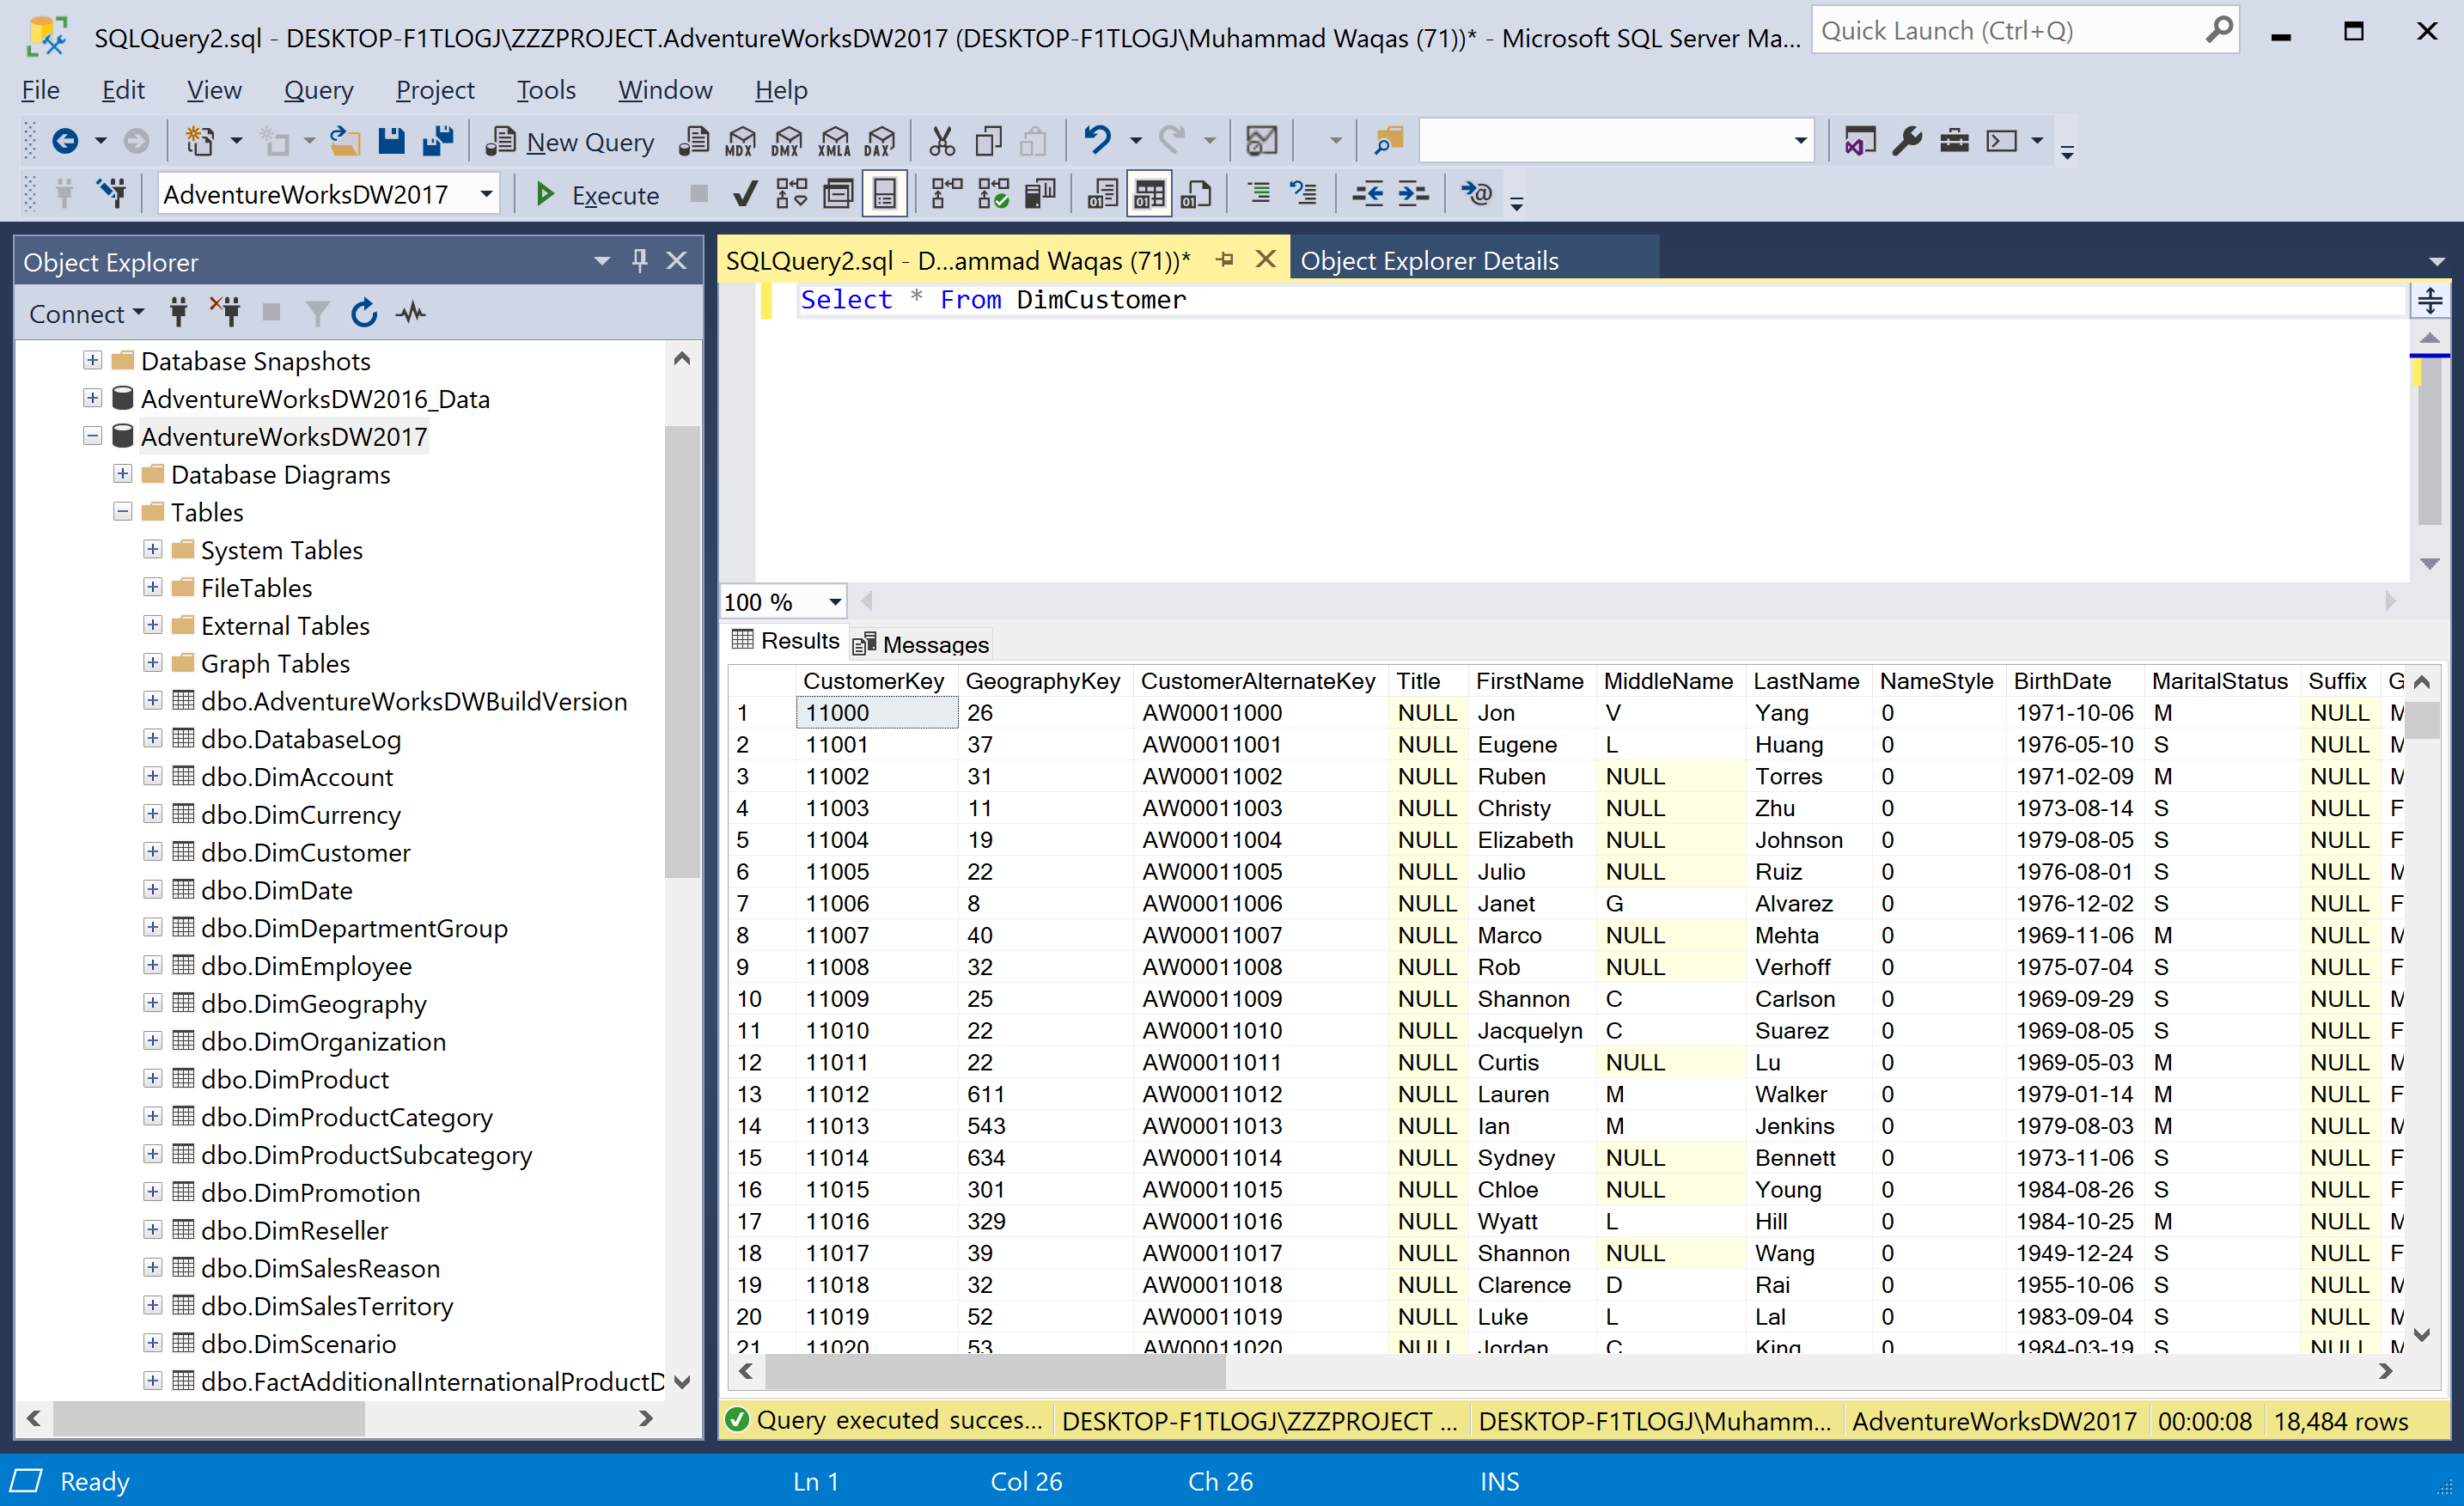
When you execute this simple query and then go to the SQL Server Profiler, you will see the query logs.
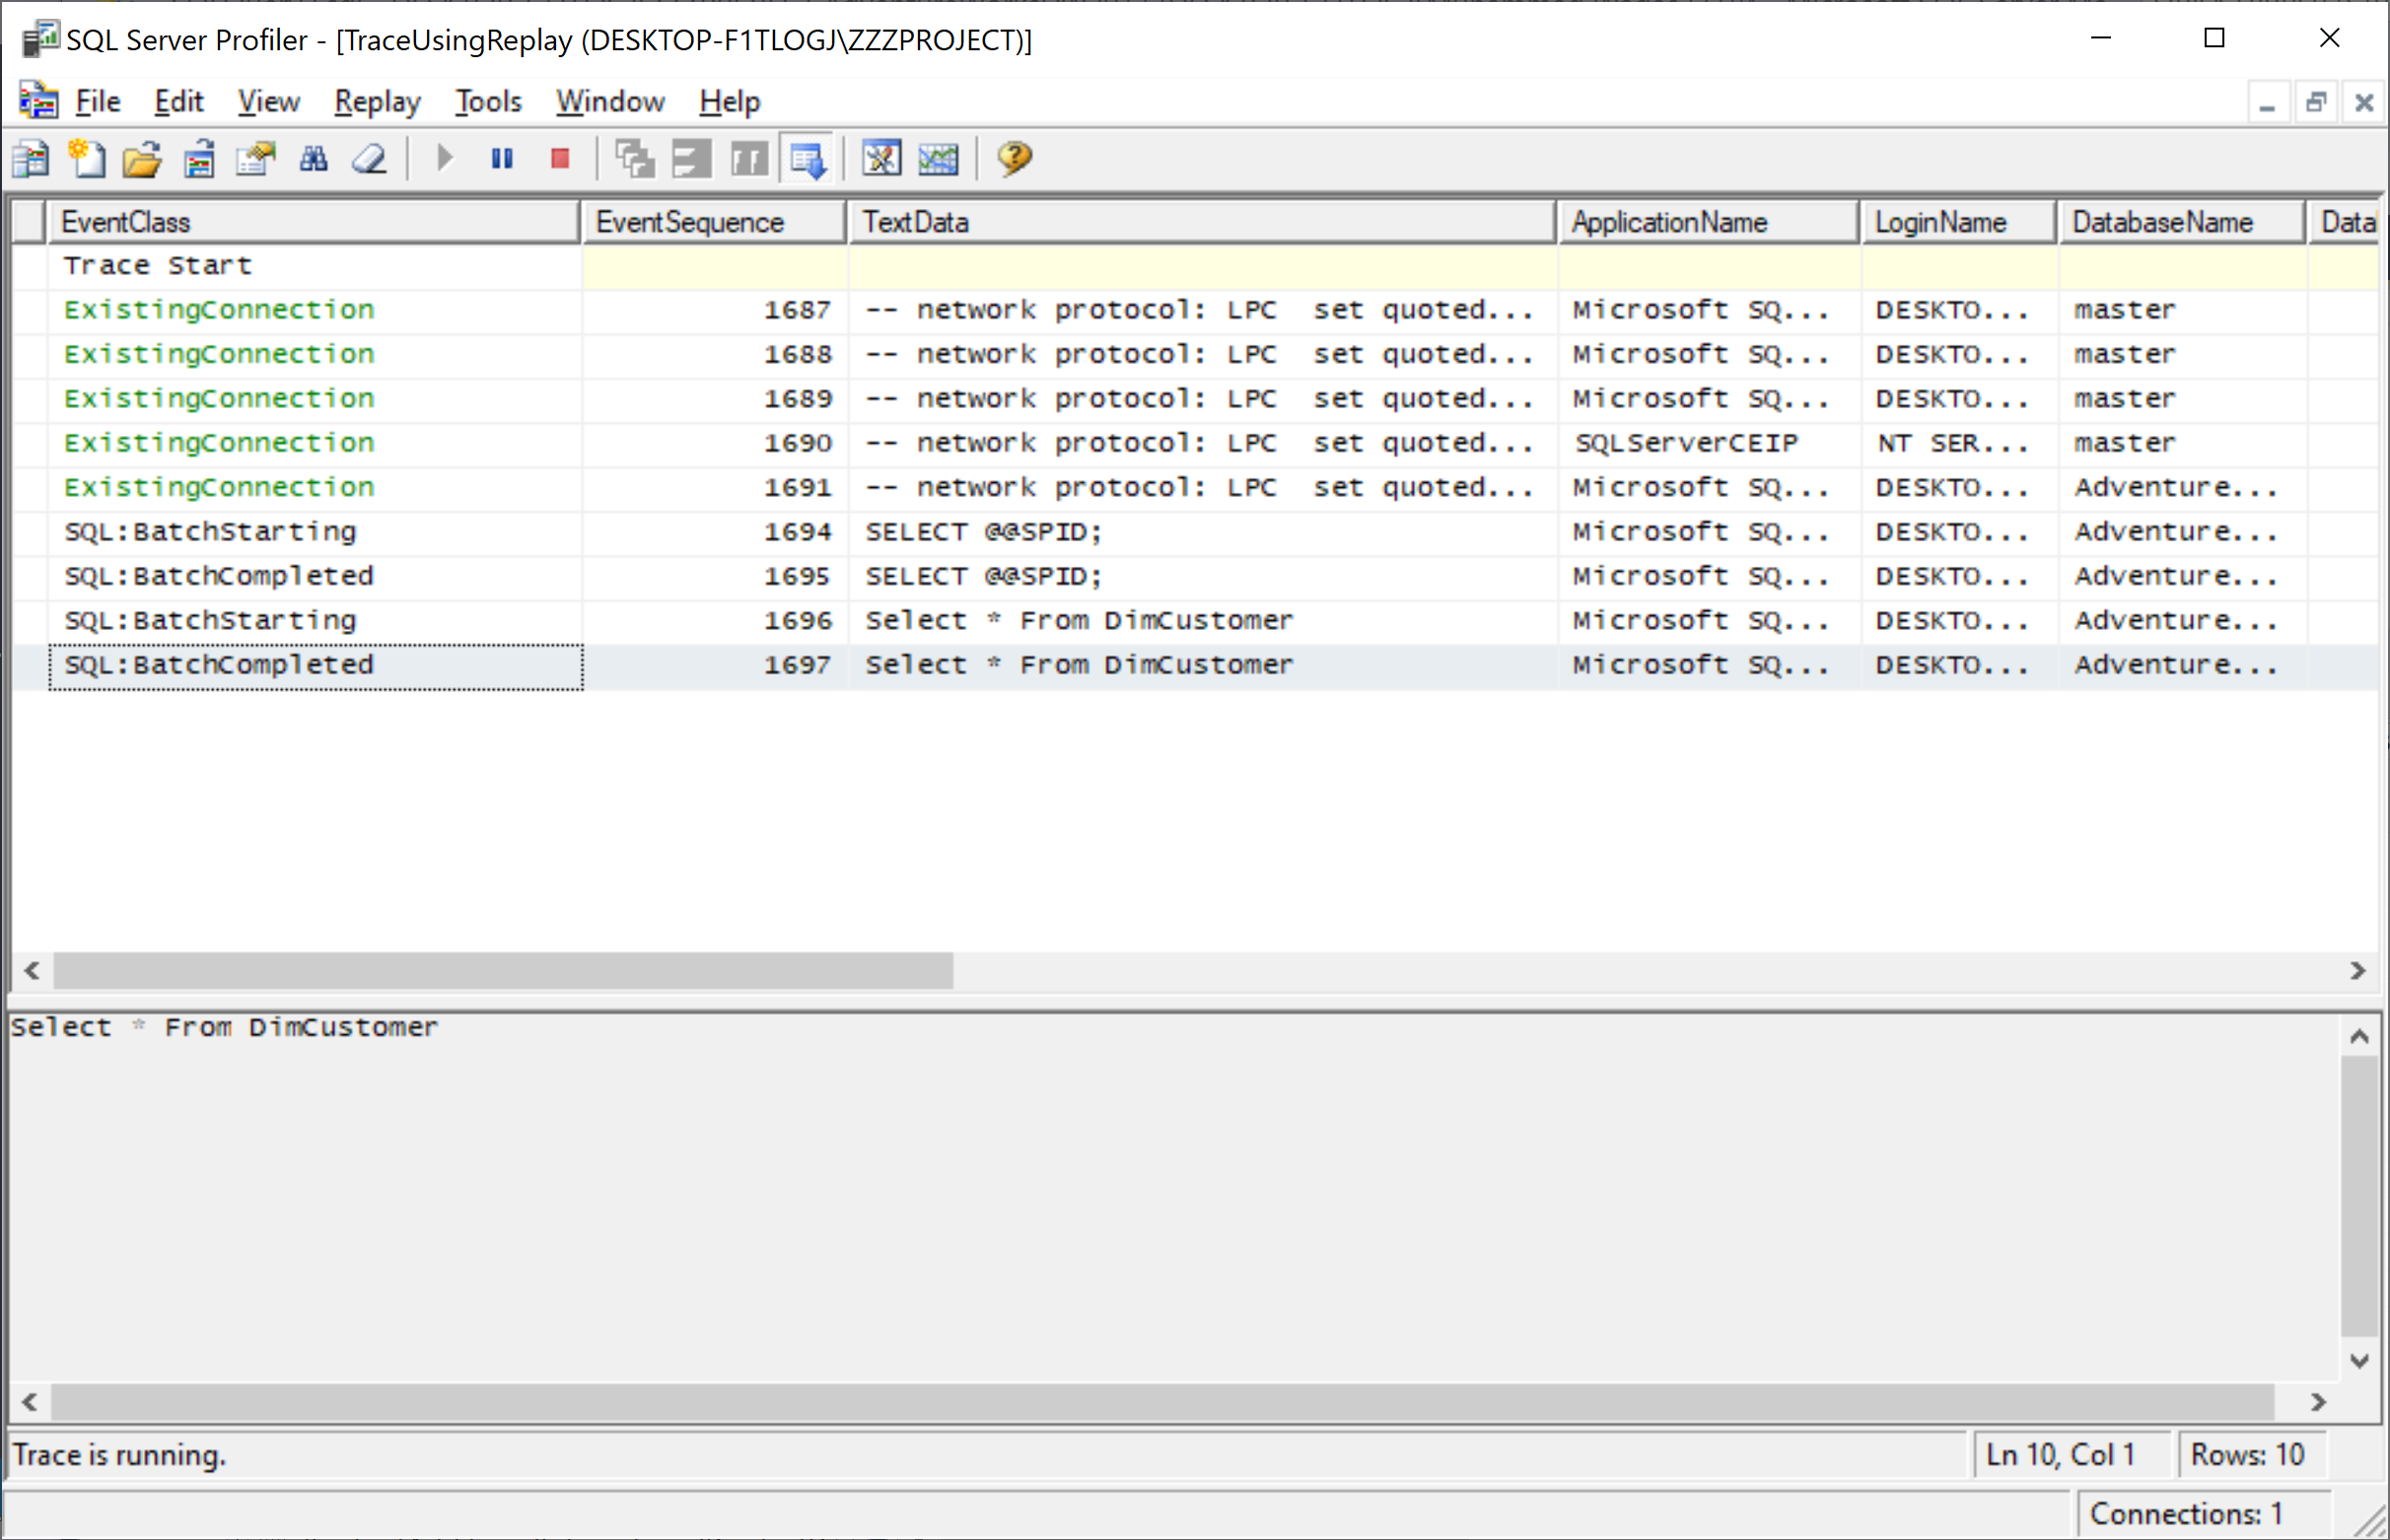
Now close the trace and open the trace table again from the File > Open > Trace Table...
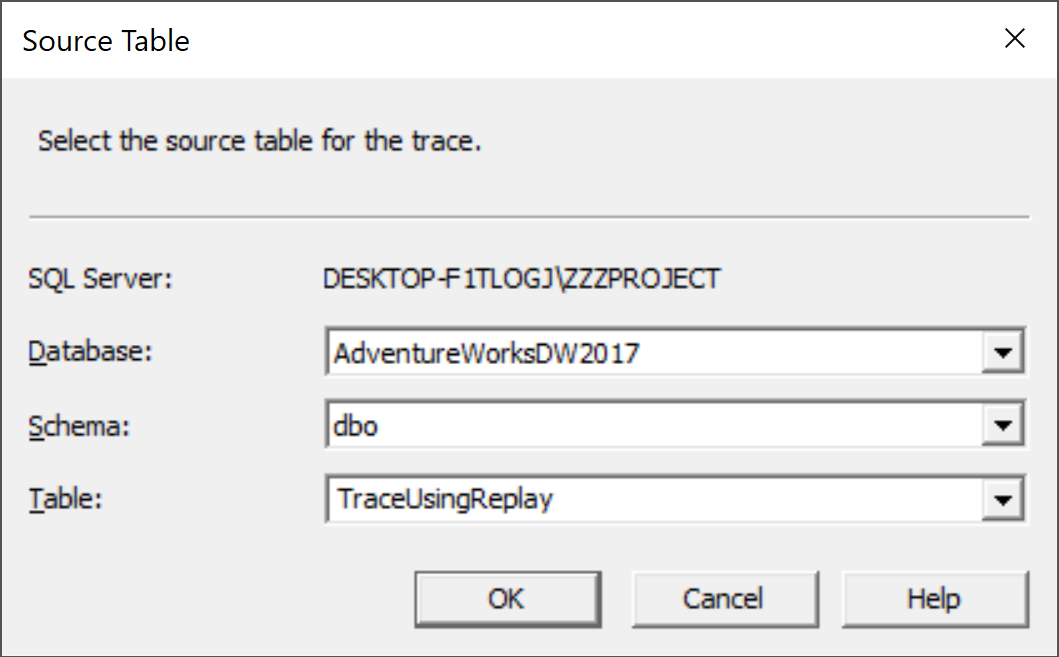
Select a trace table on the Source Table dialog and click the OK button.
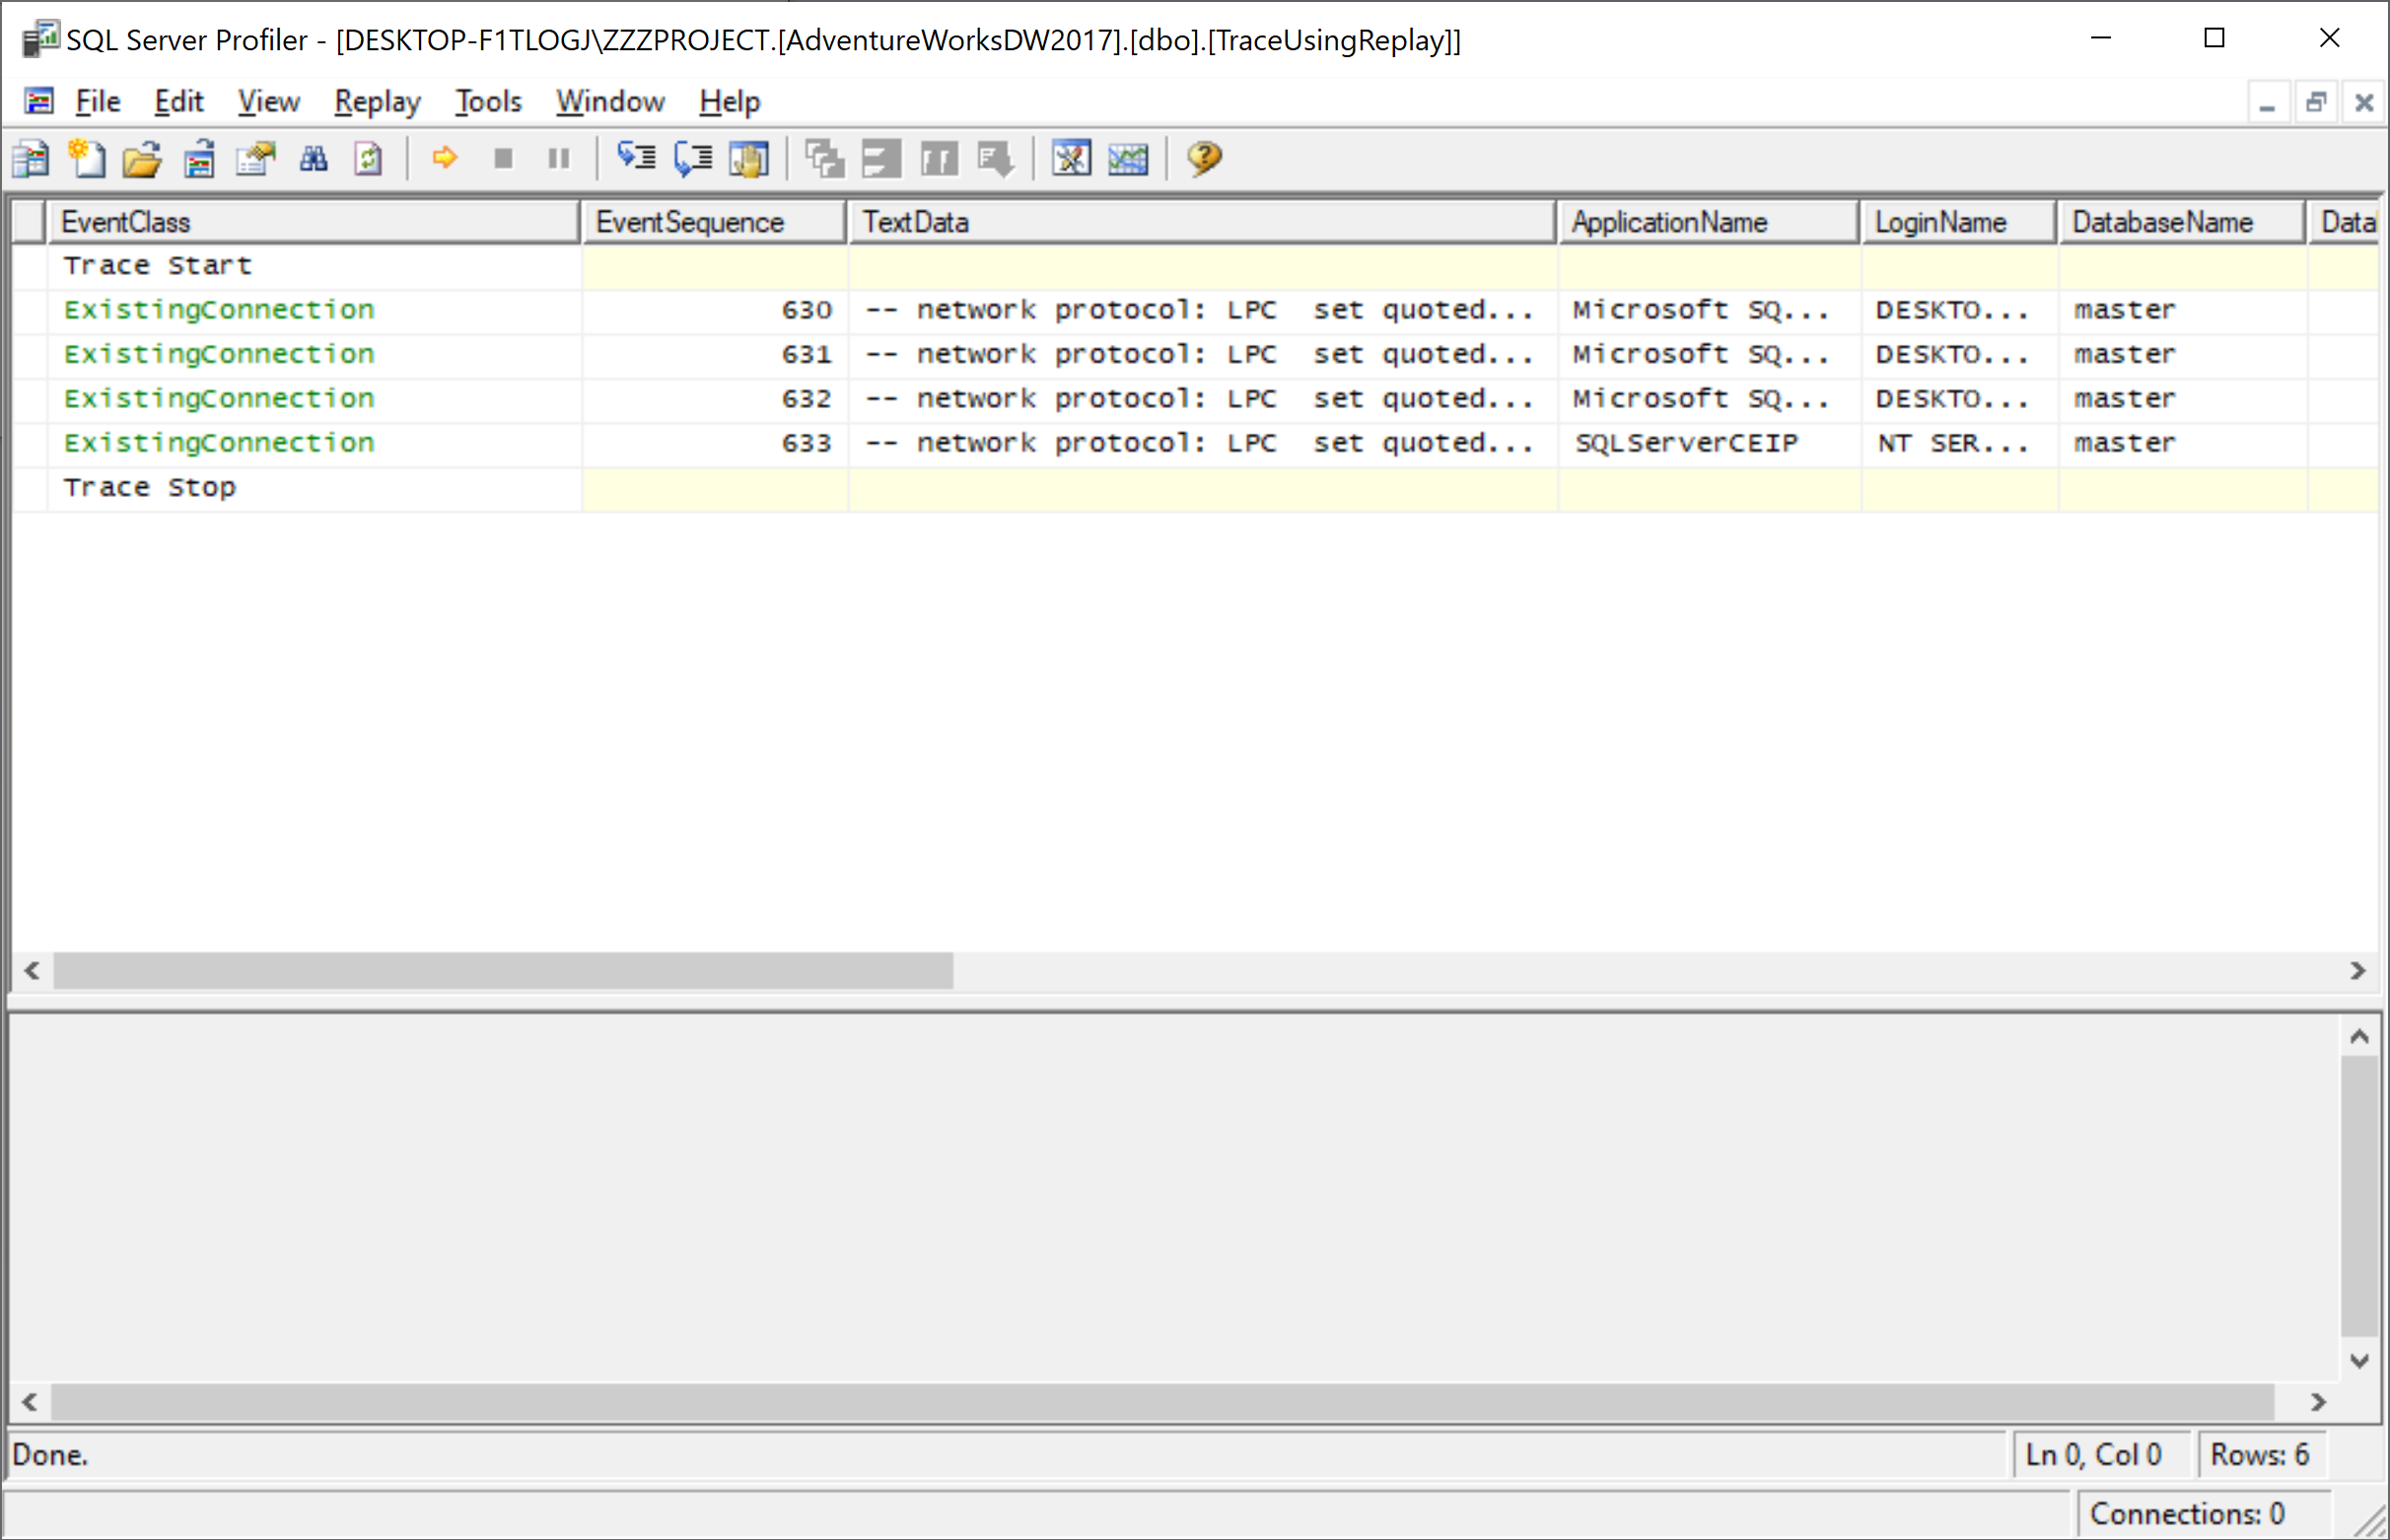
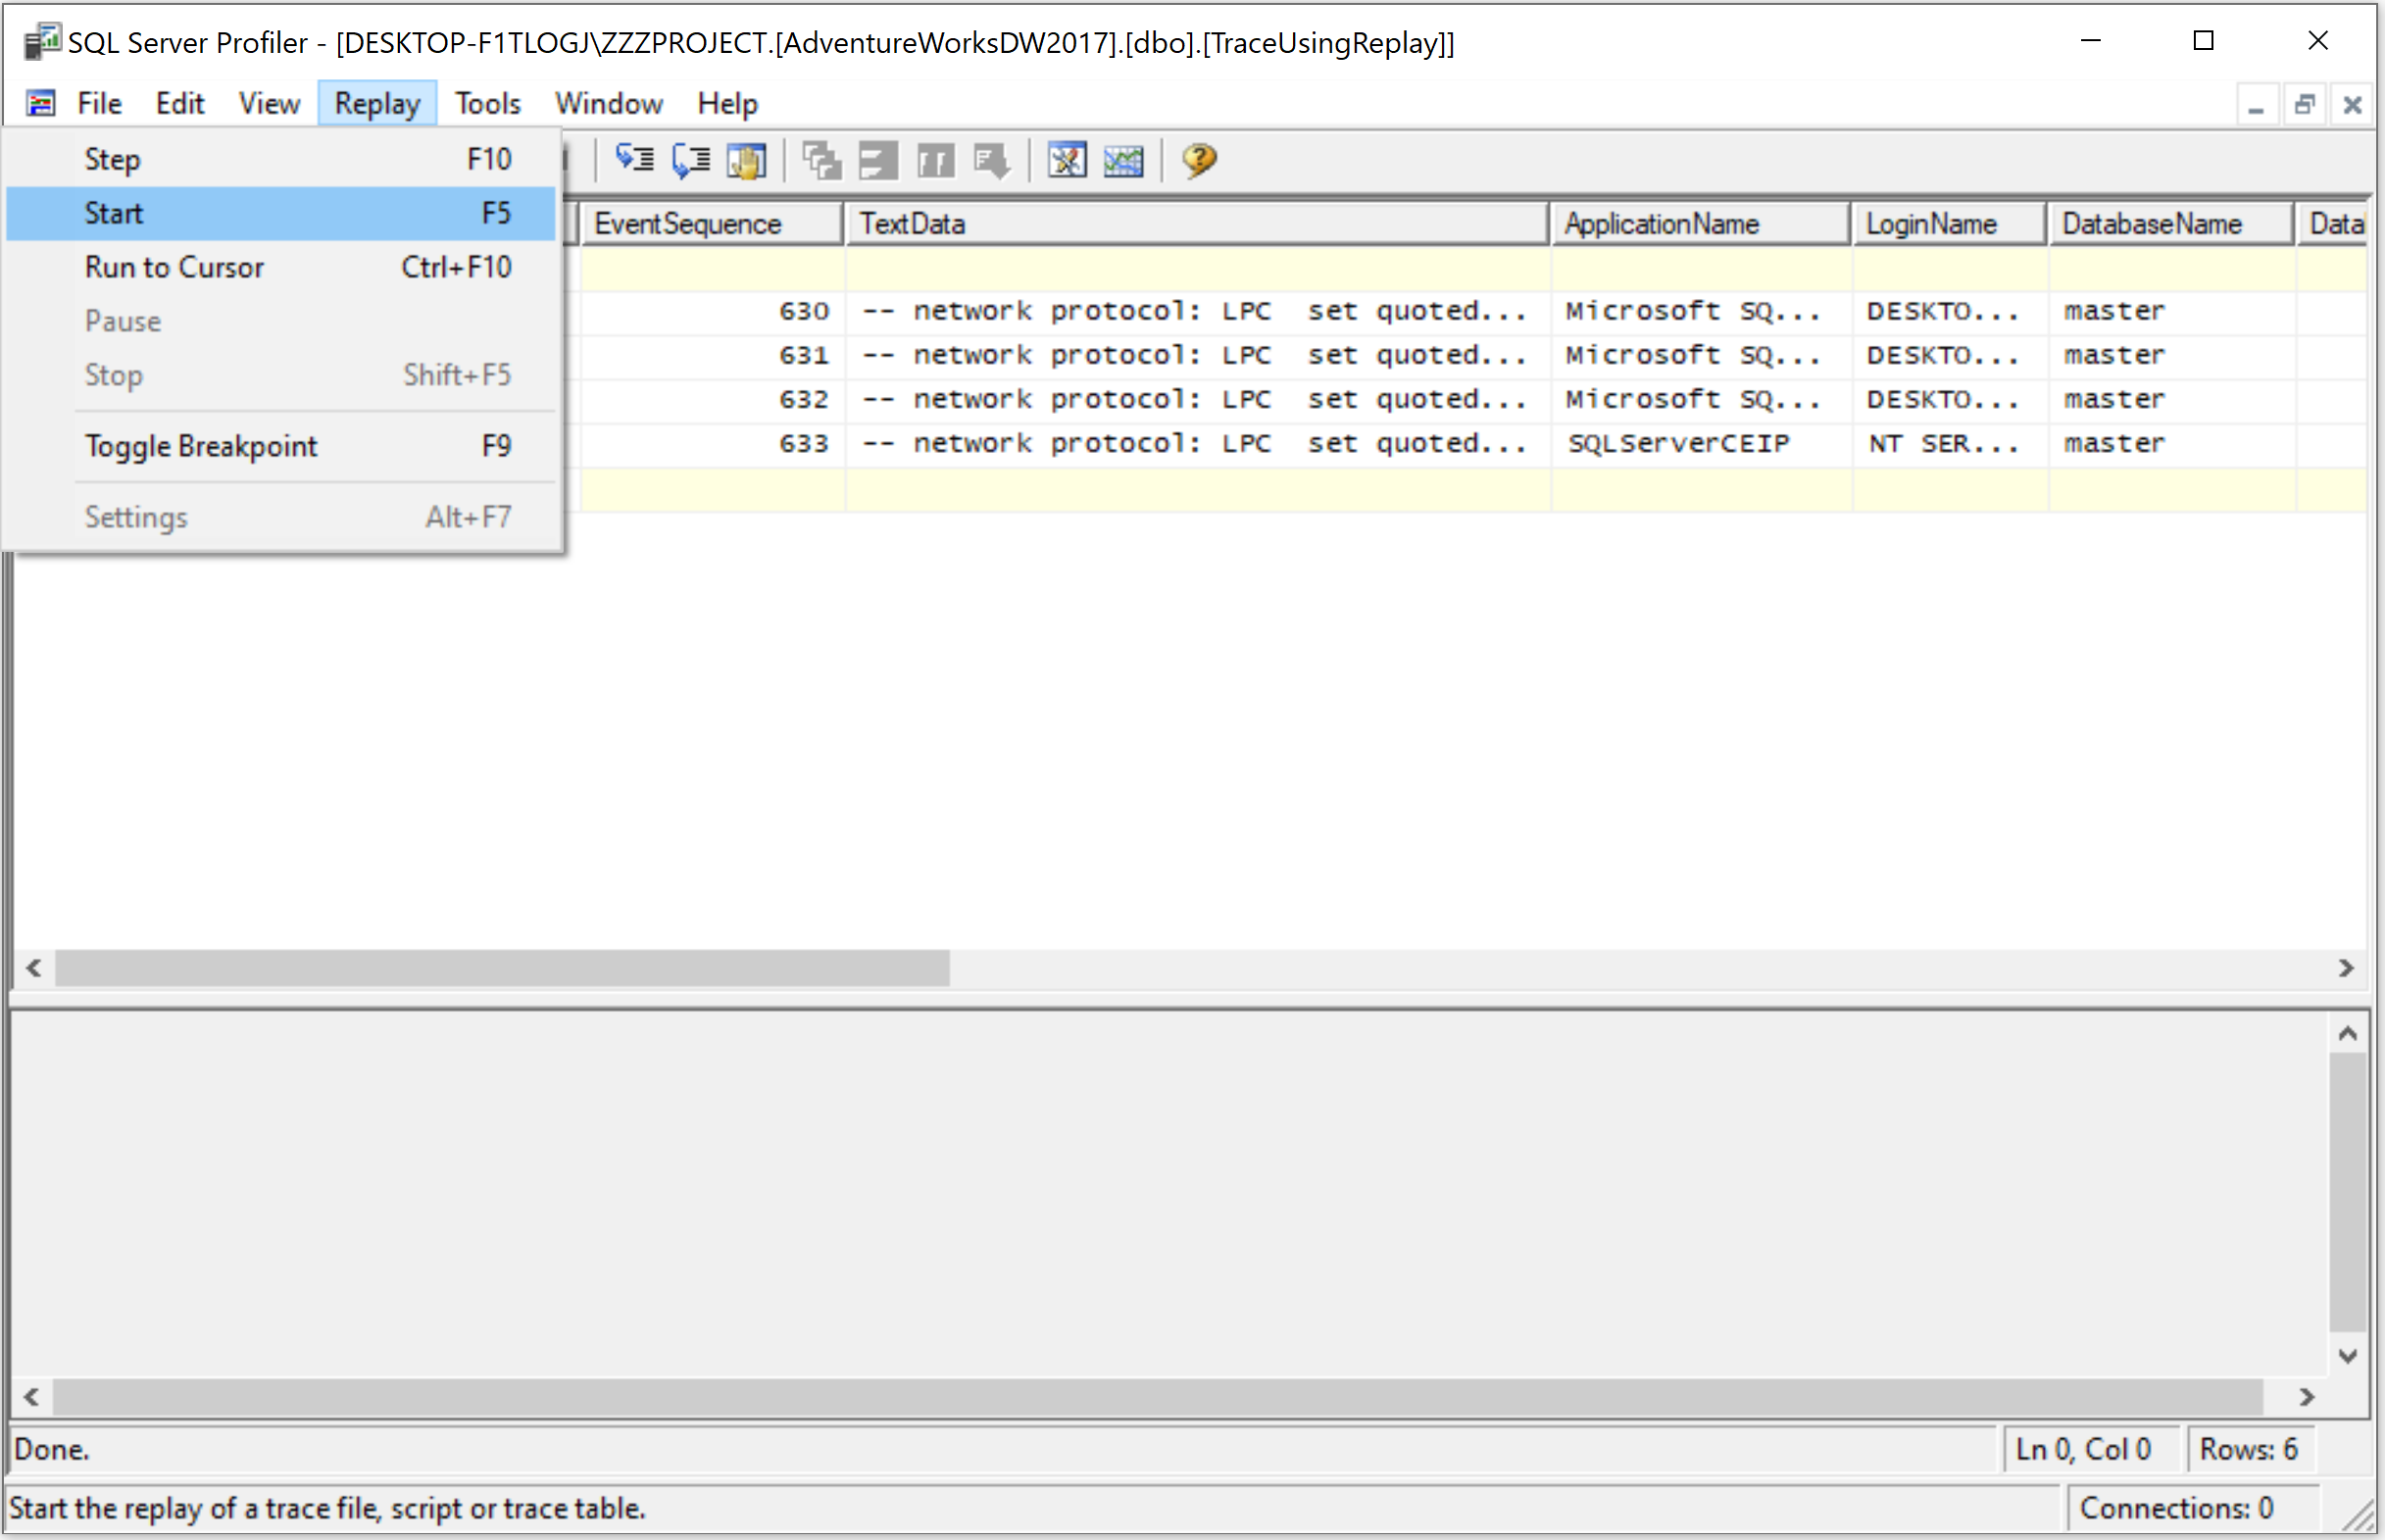
Select the Replay > Start menu, and connect to the server instance where you want to replay the trace.
It will open the Replay Configuration dialog. On the Basic Replay Options tab, specify Replay server.
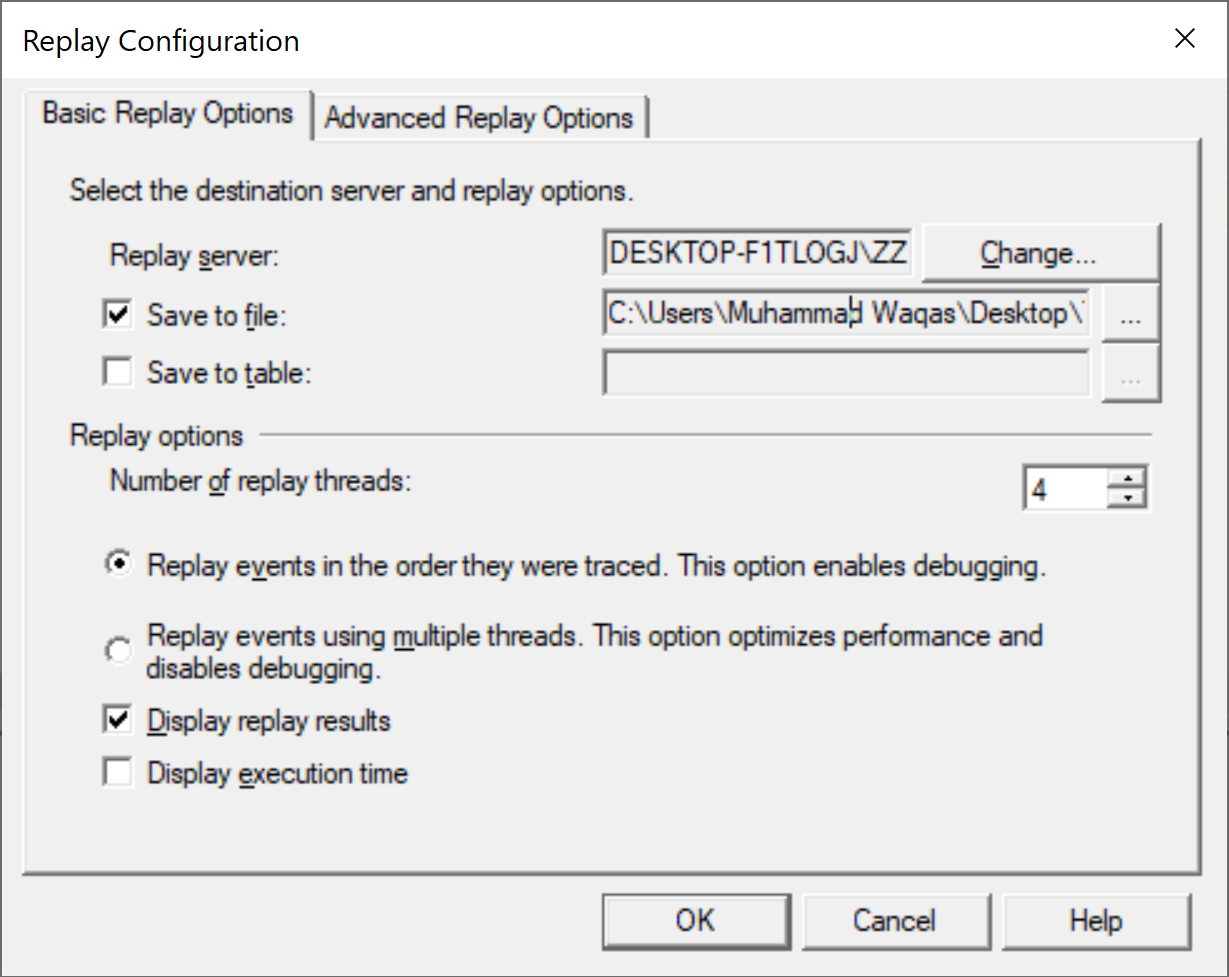
You can save the replay in either a file or database table. So let's select Save to file option and specify the file.
In the Replay options section, choose the Replay the events in the order they were traced option and select the Display replay results to view the replay as it occurs and click the Advanced Replay Options tab.
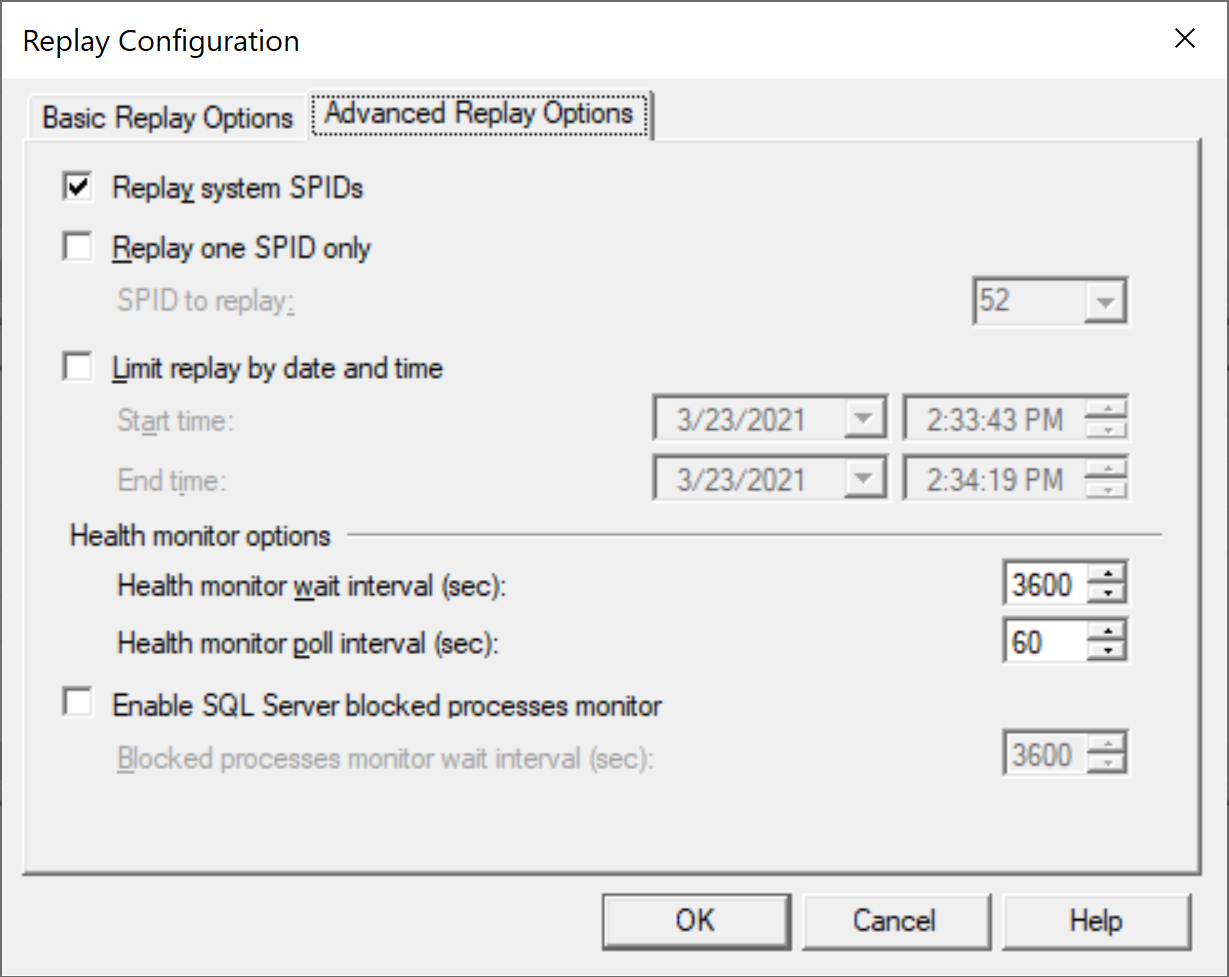
Select Replay system SPIDs and then click the OK button.
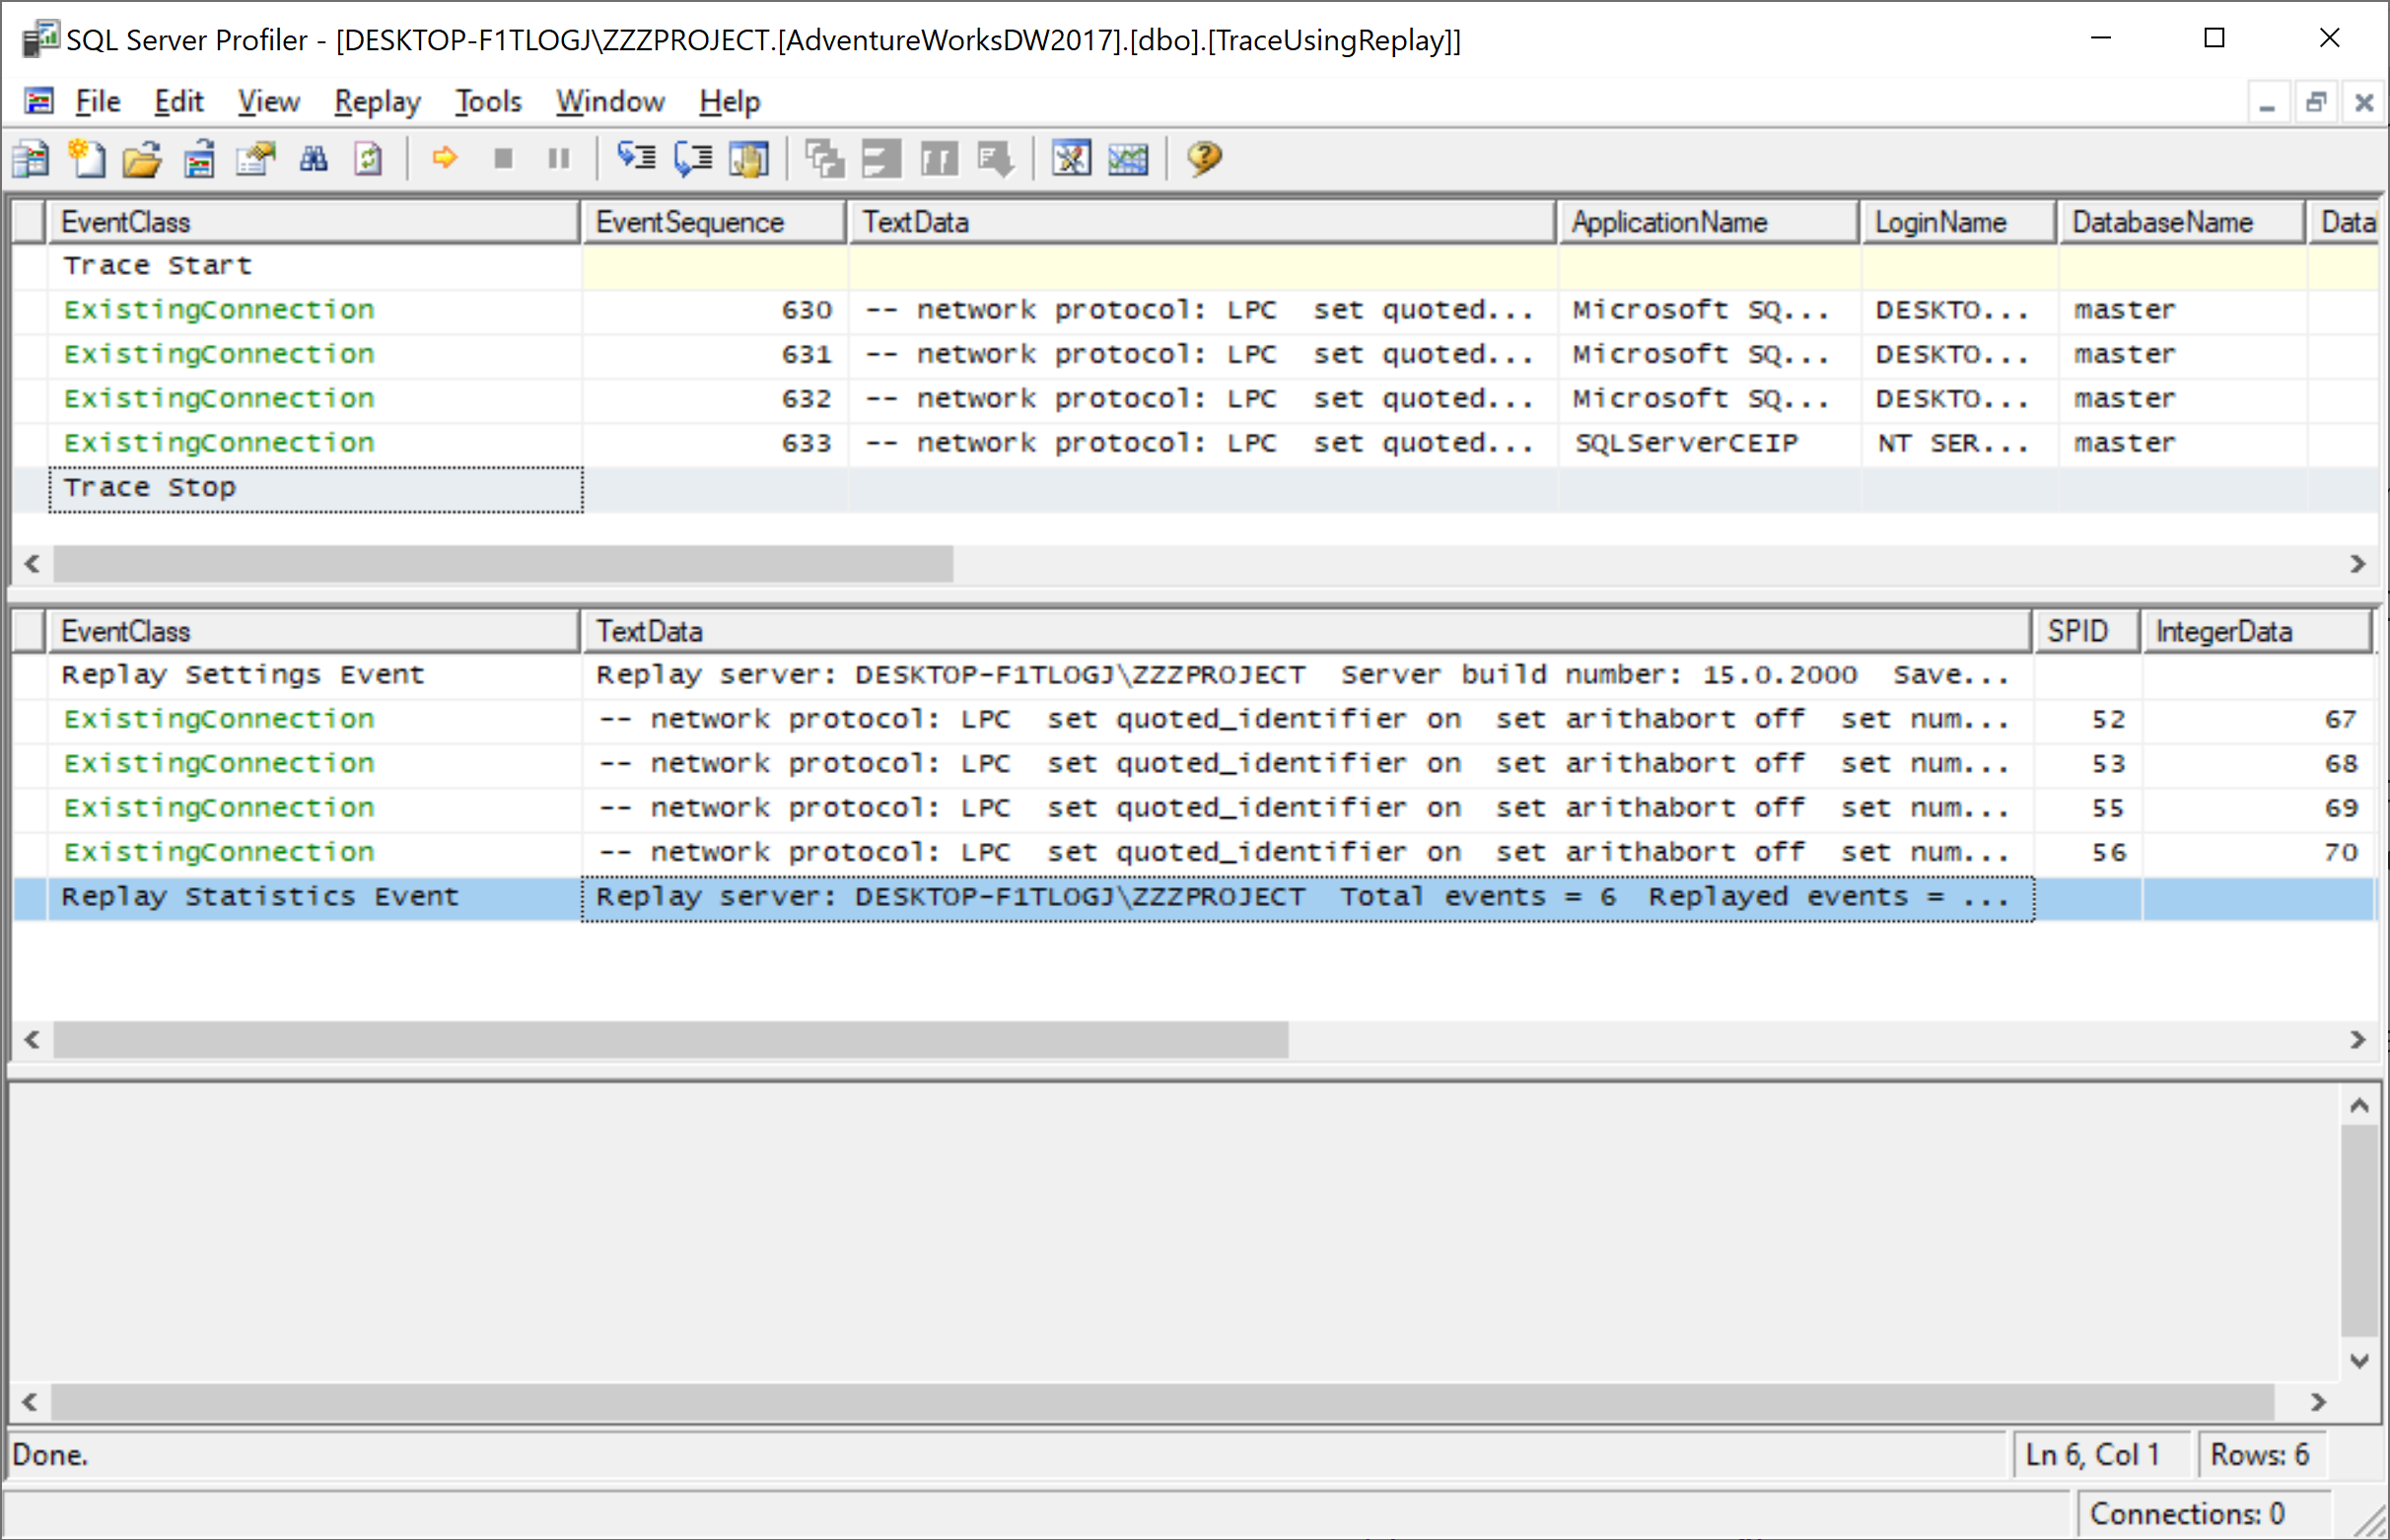
You can see the replayed events.
