SQL Server Profiler Create a Trace
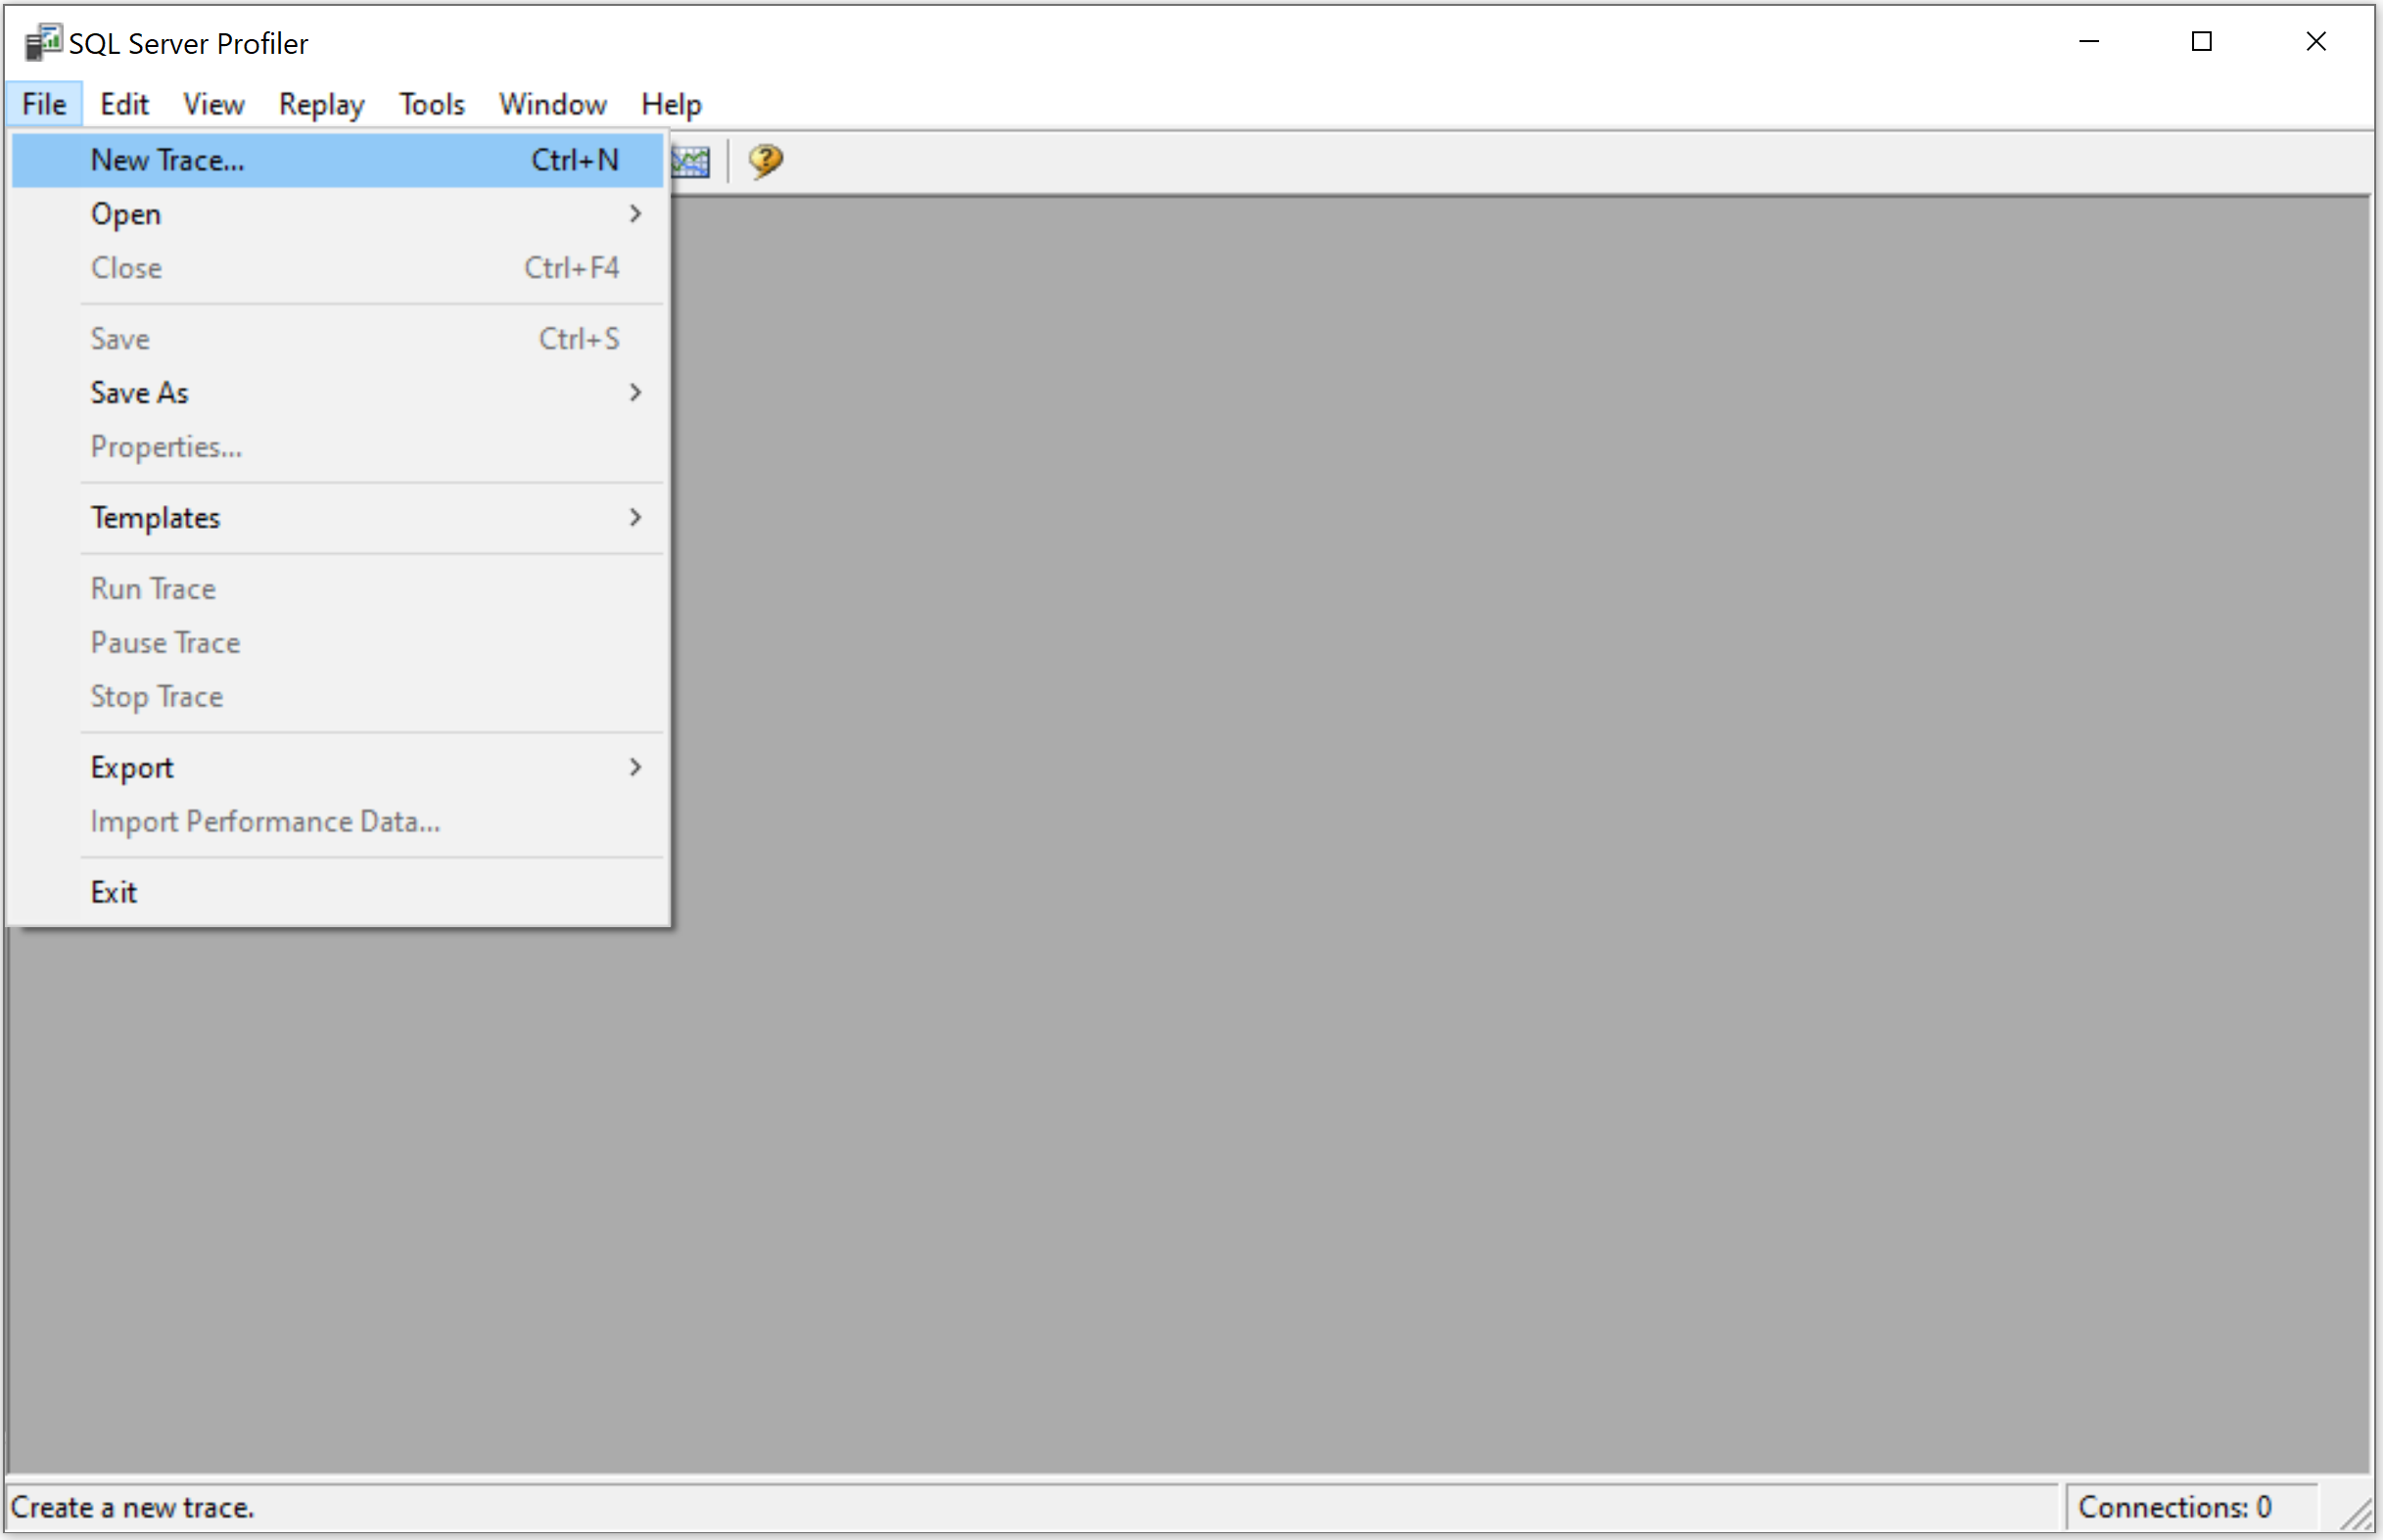
Tracing events in SQL Server is key to understanding and optimizing database workloads. To create a trace, go to the File > New Trace menu.
It will open the Connect to Server dialog.
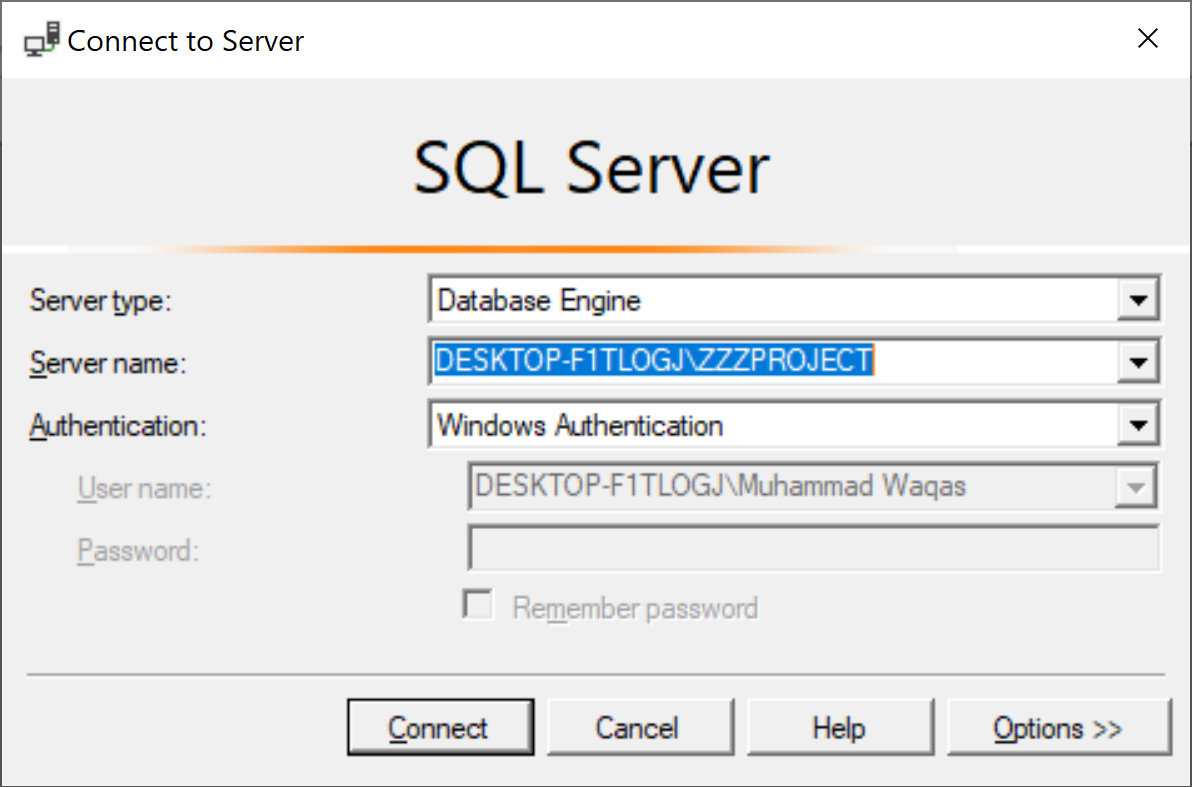
Click on the Connect button to connect to an SQL Server instance and then open the Trace Properties dialog.
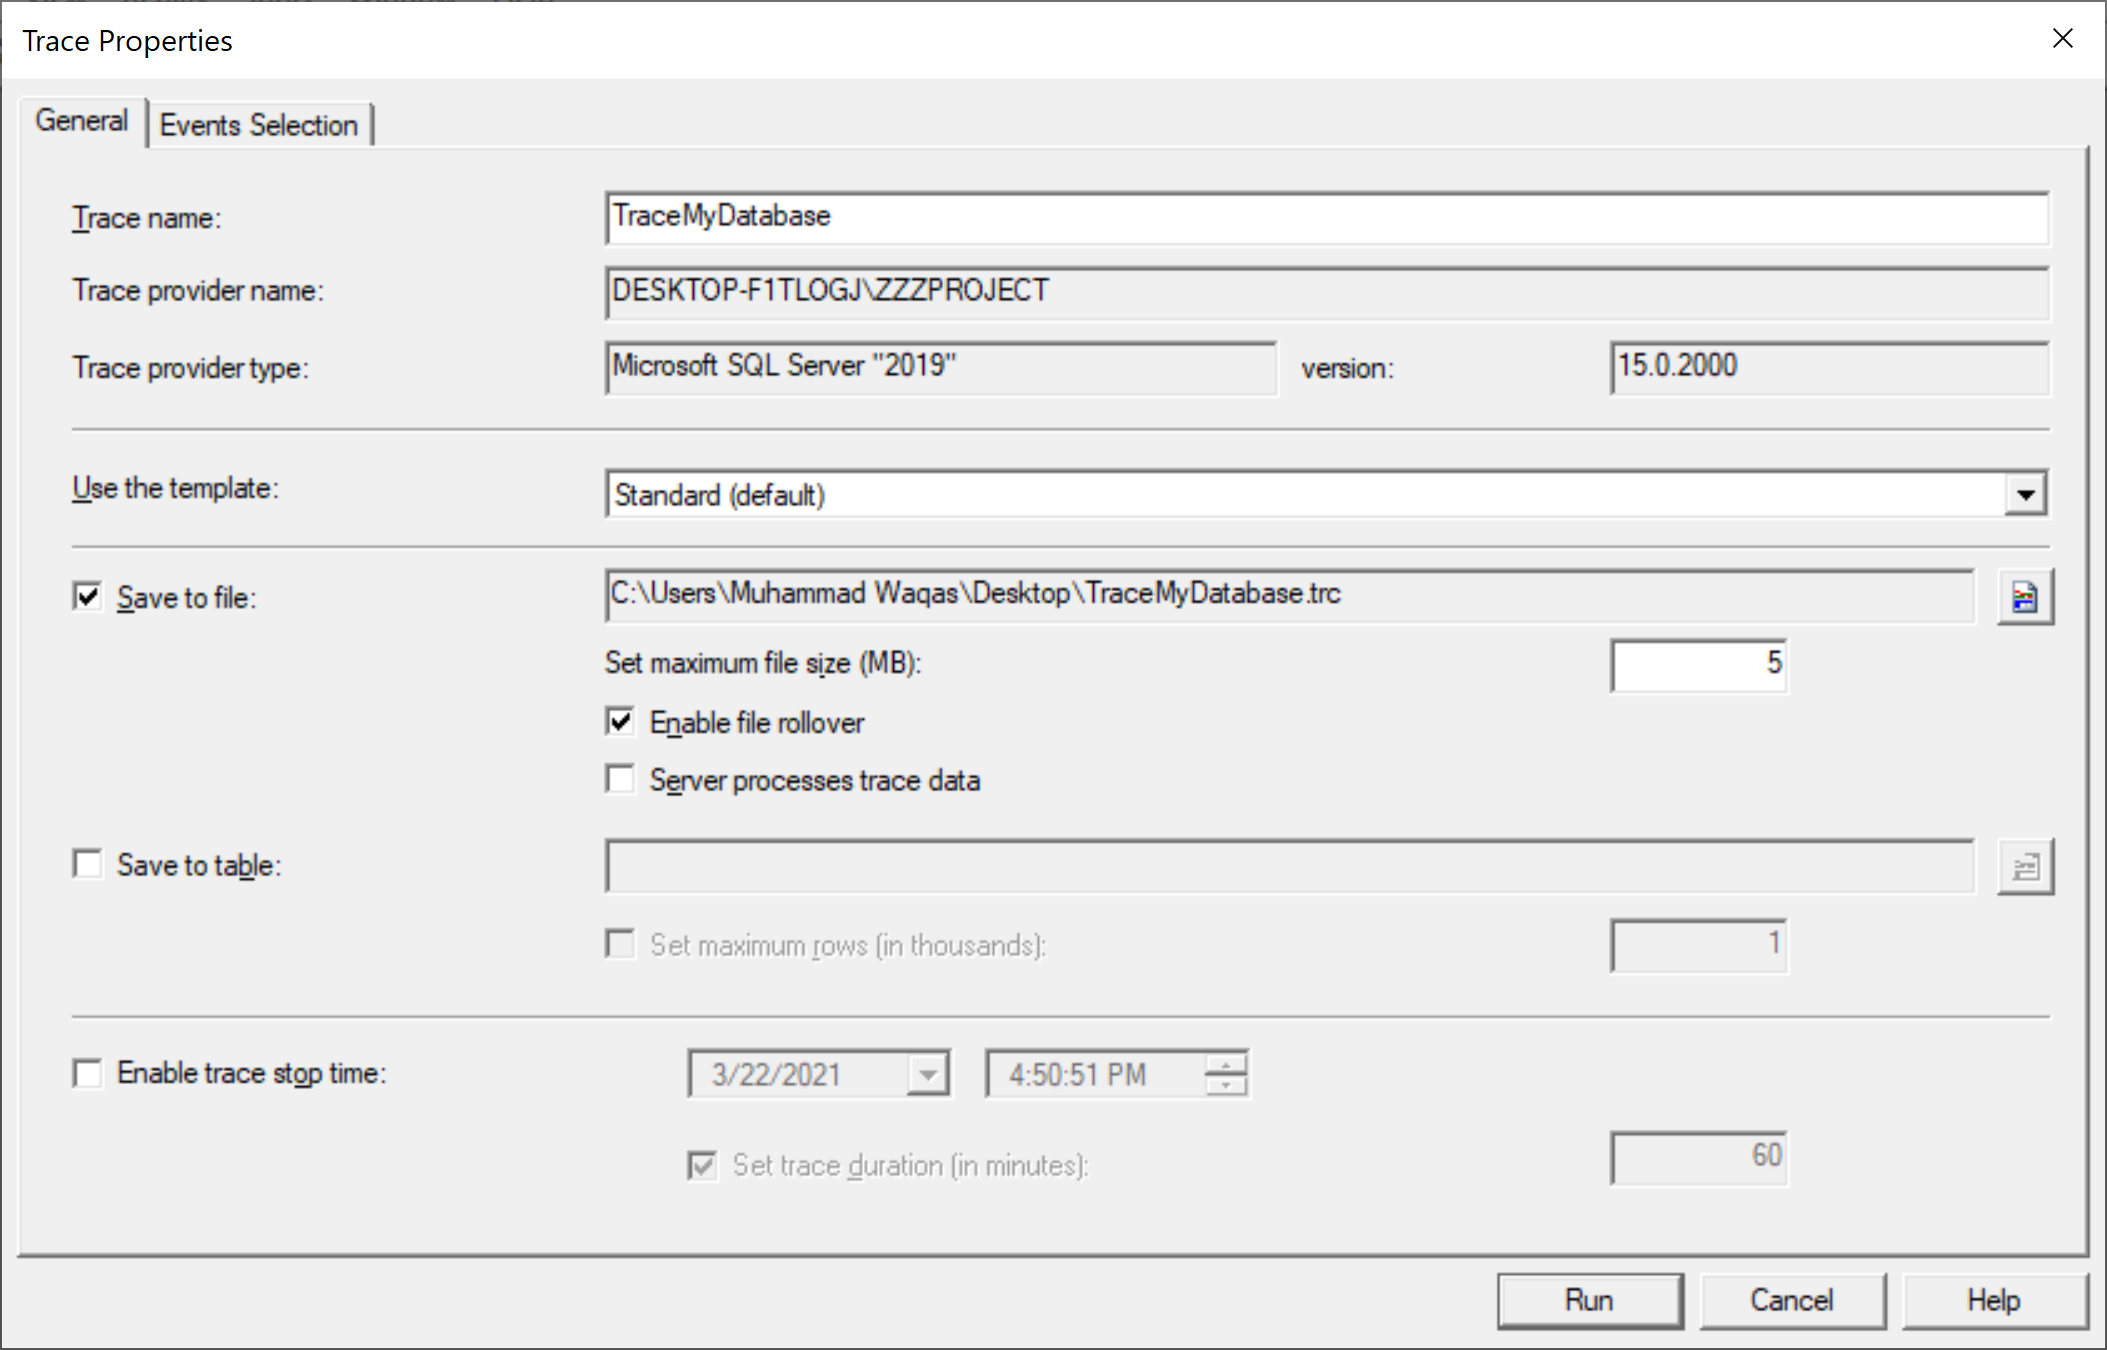
In the Trace name field, type a name for the trace, and in the Use the template list, select a trace template on which to base the trace.
To save the trace results, we have two options.
Save to File
You can choose the Save to file option to capture the trace to a file.
- You can set a value for Set maximum file size (MB), and the default value is 5MB.
- To automatically create new files when the maximum file size is reached, check the Enable file rollover checkbox.
- When the Server processes trace data option is checked, it causes the service running the trace to process trace data instead of the client application.
- When the server processes trace data, its performance may be affected but no events are skipped even under stress conditions.
Save to Table
You can choose Save to table option to capture the trace to a database table. You can also Set maximum rows and specify a value.
When you do not save the trace results to a file or table, you can view the trace while SQL Server Profiler is open.
- When you stop the trace and close SQL Server Profiler, you will lose the trace results.
- To prevent data loss, you can save the results before closing the SQL Server Profiler from the File > Save menu.
You can also select the Enable trace stop time check box and specify a stop date and time.
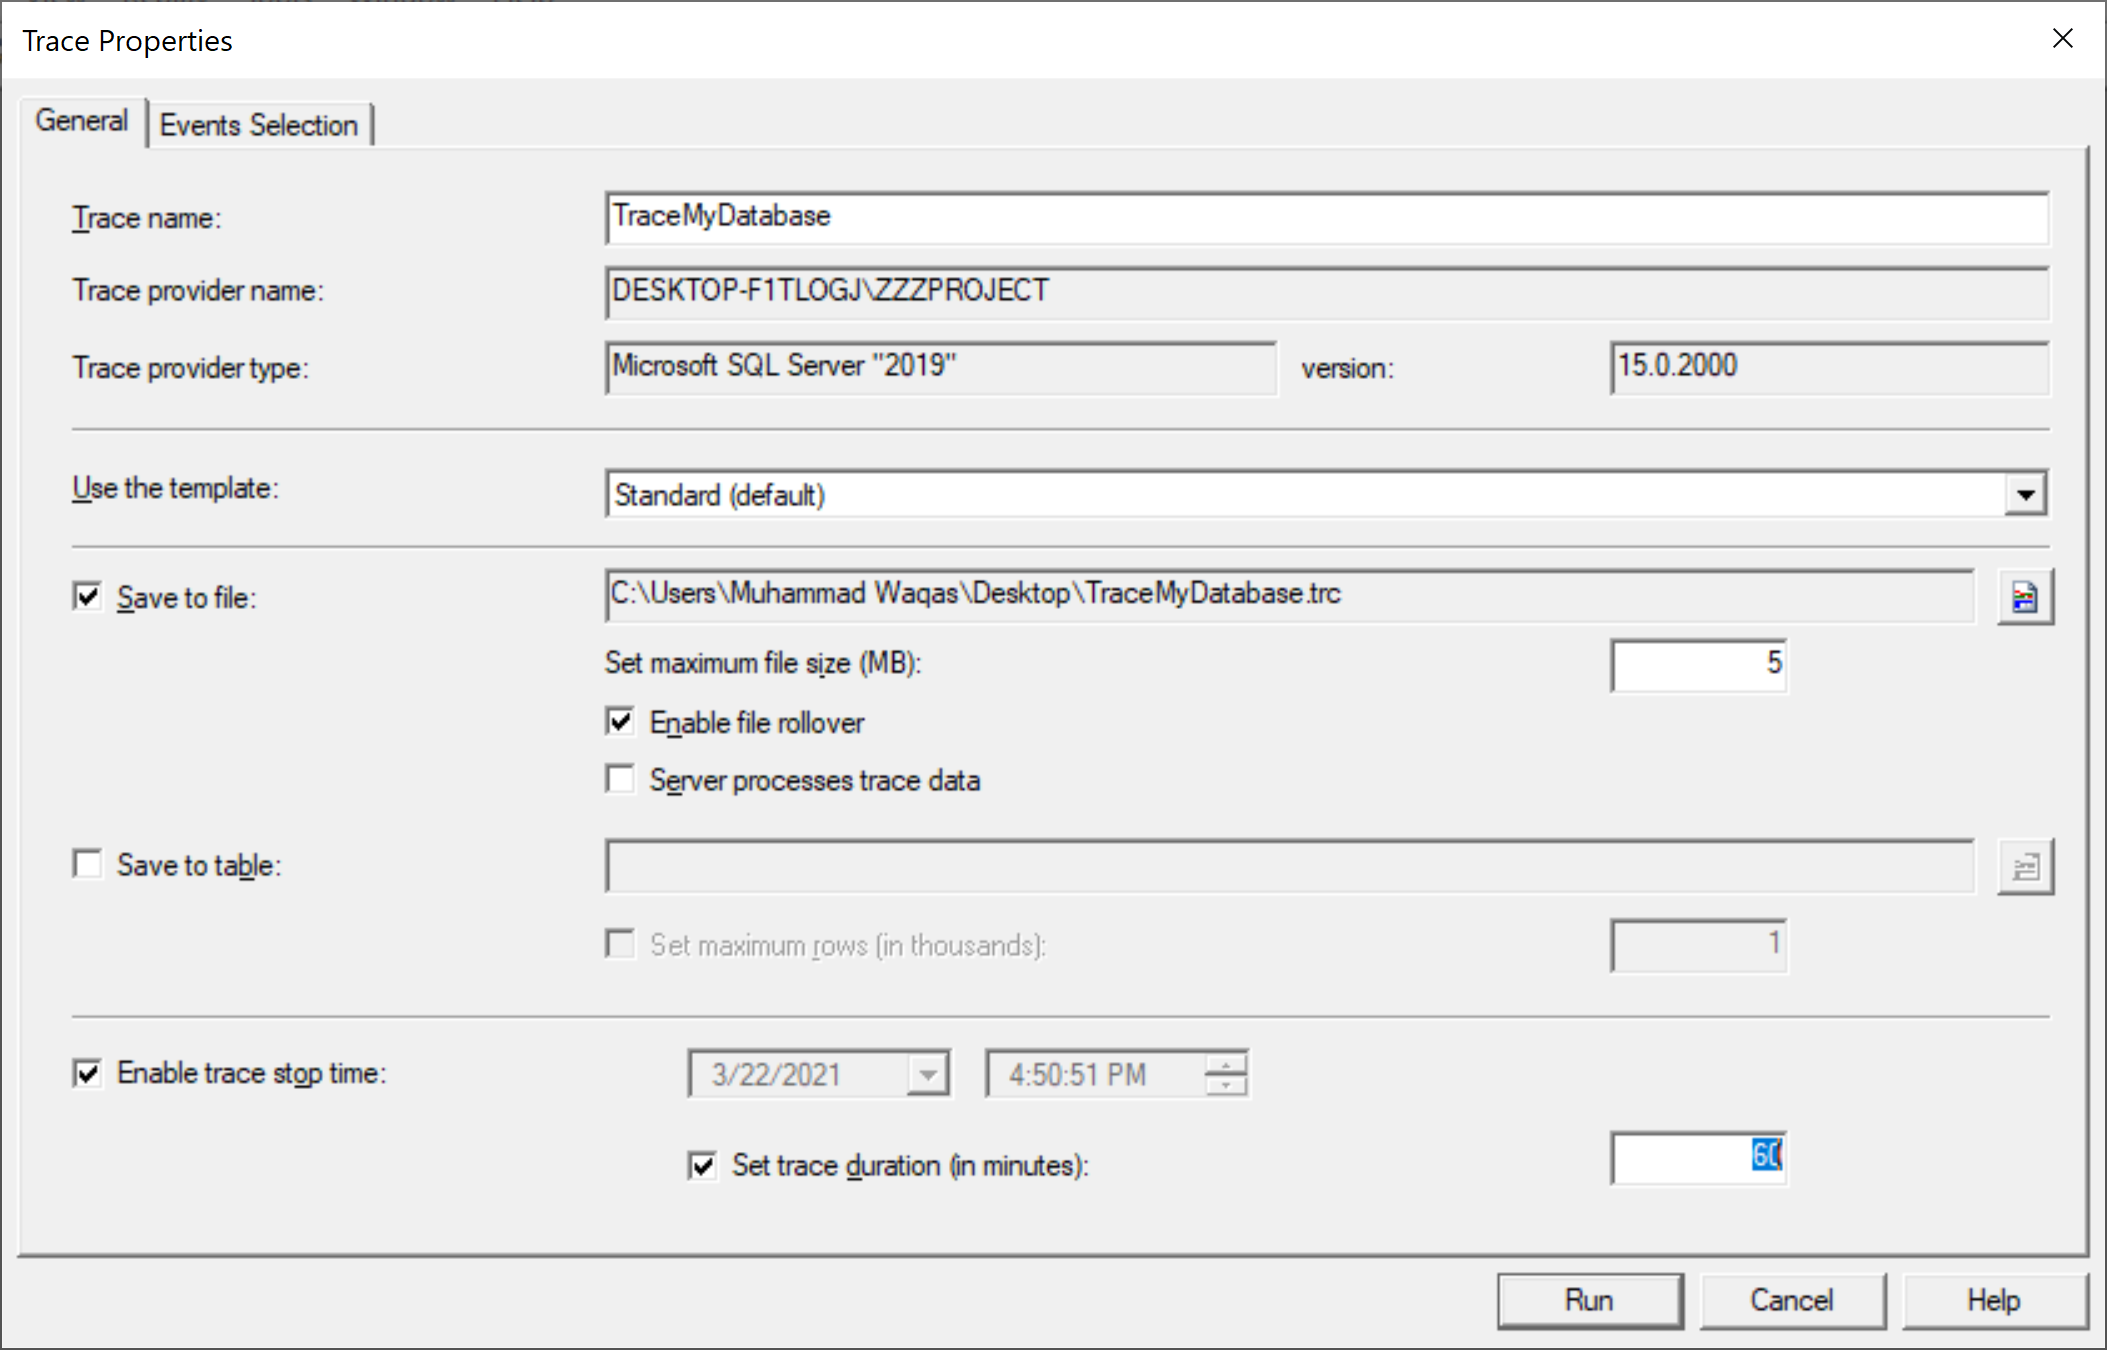
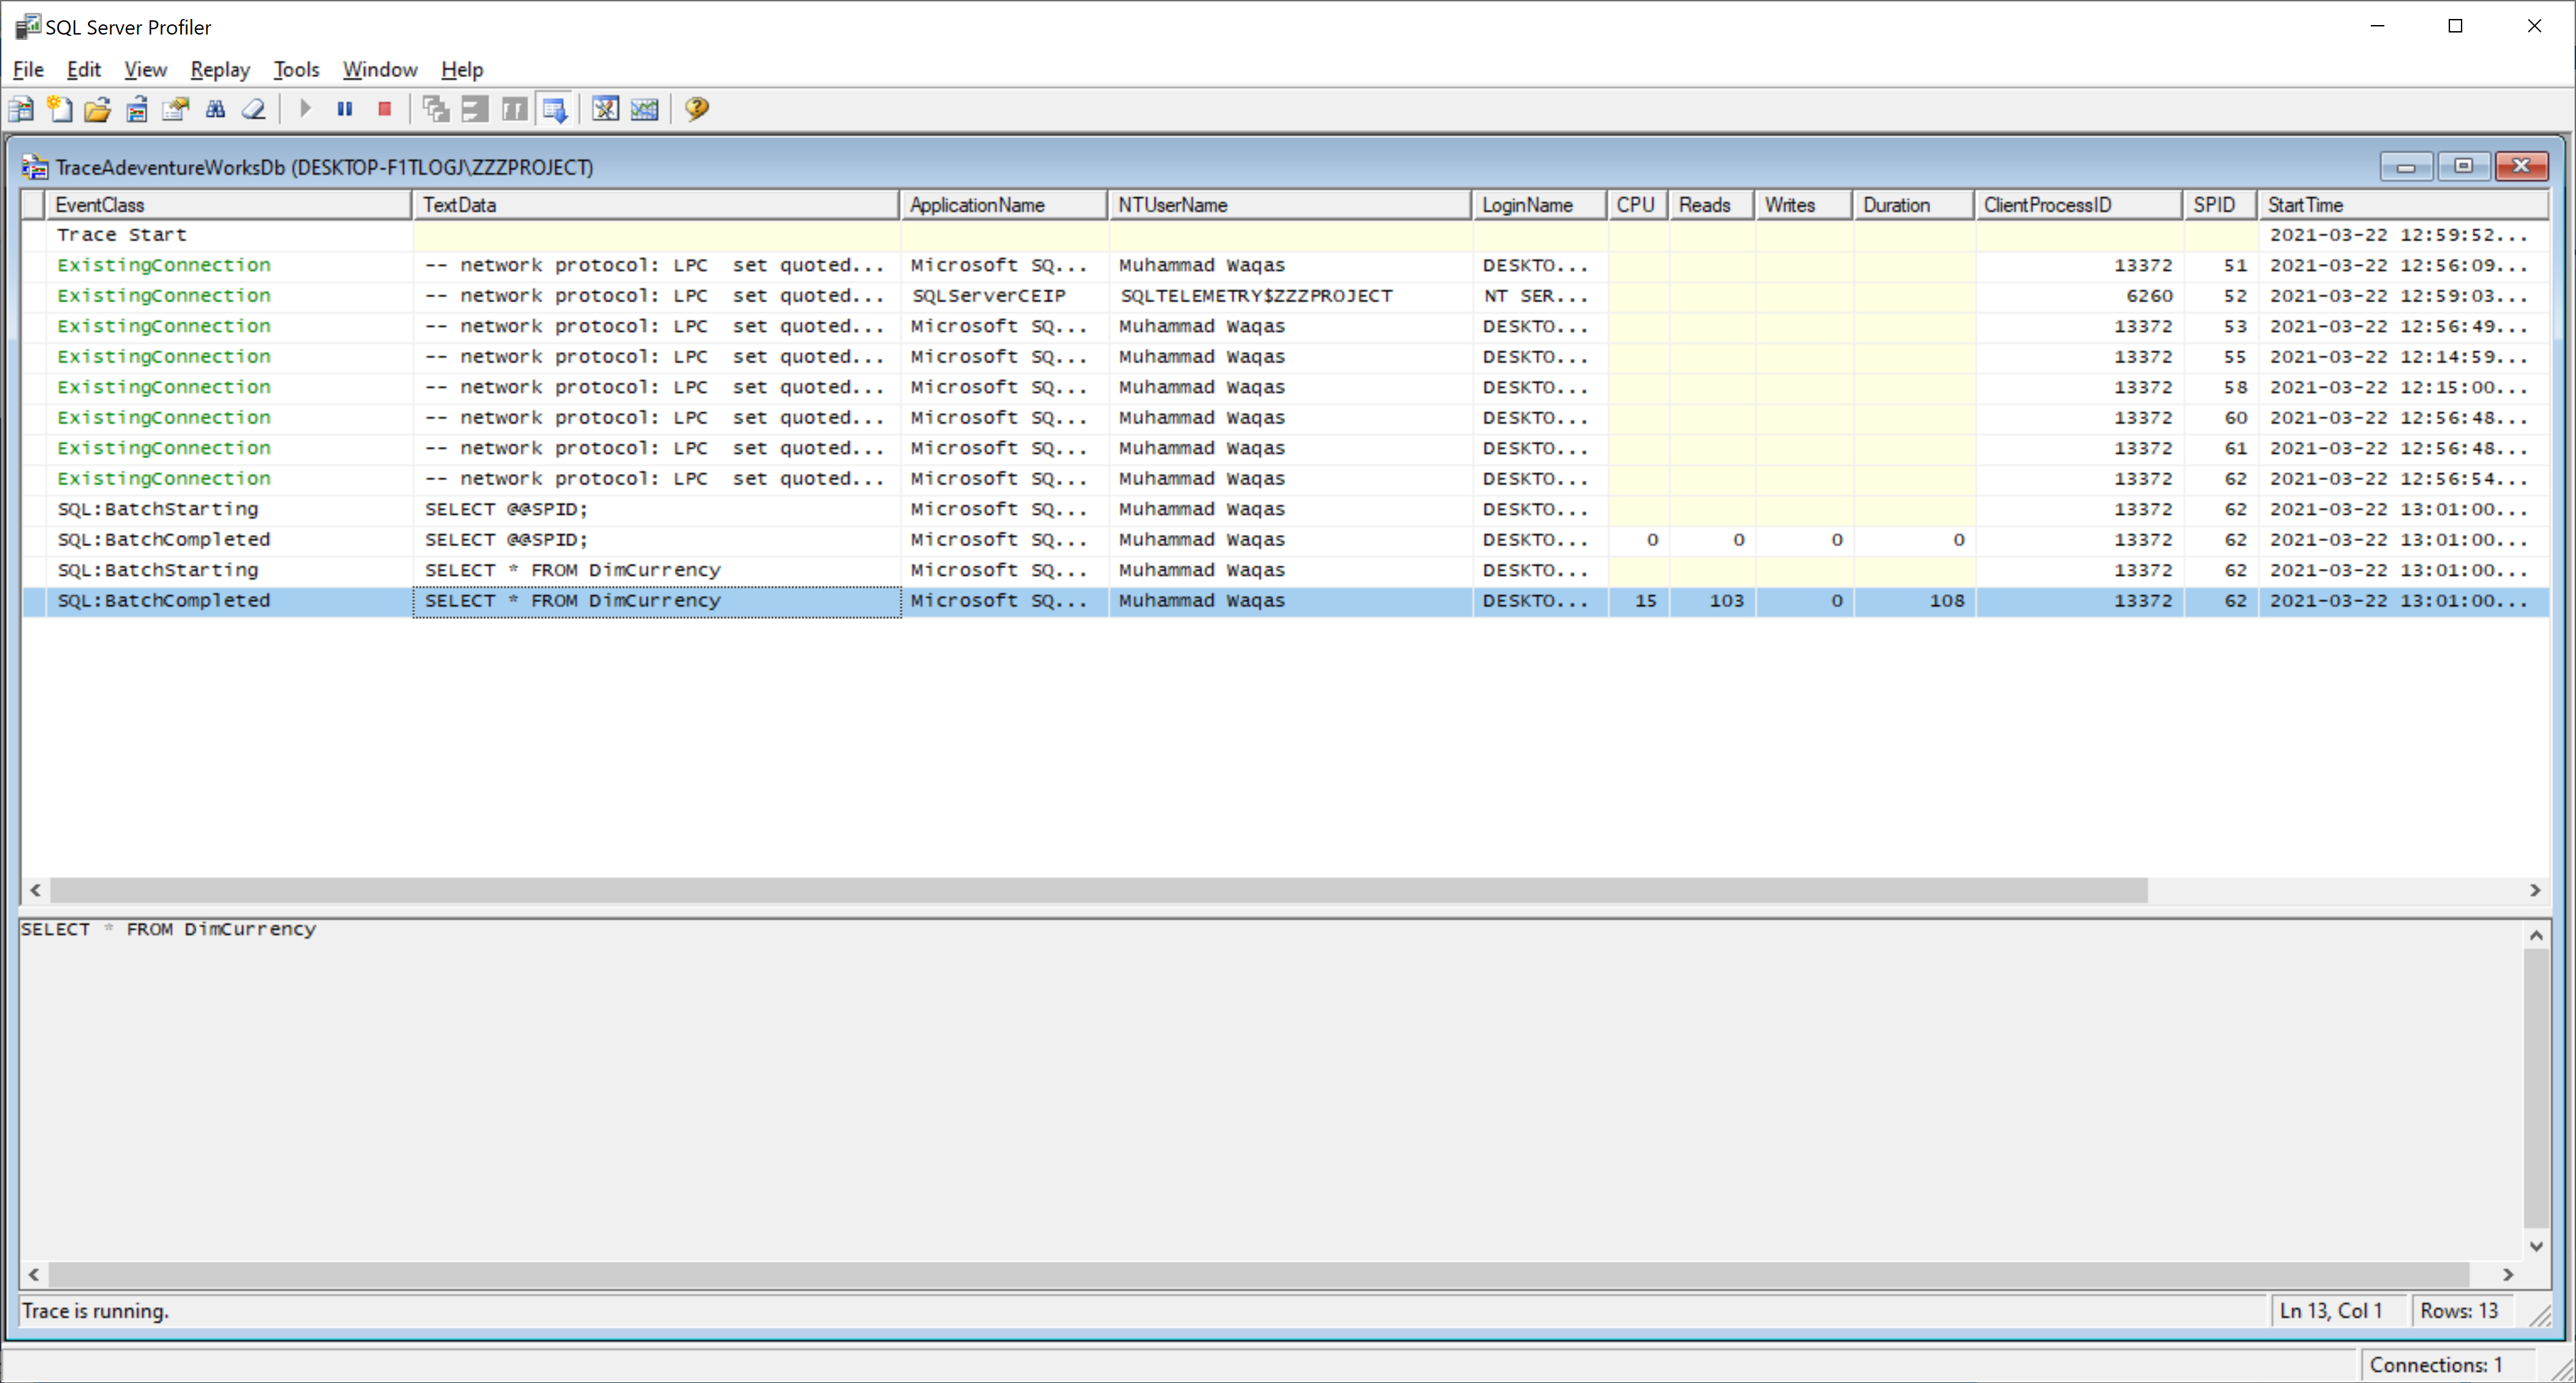
Click RUN to start the trace, the SQL Profiler window will open, and the trace is now running.
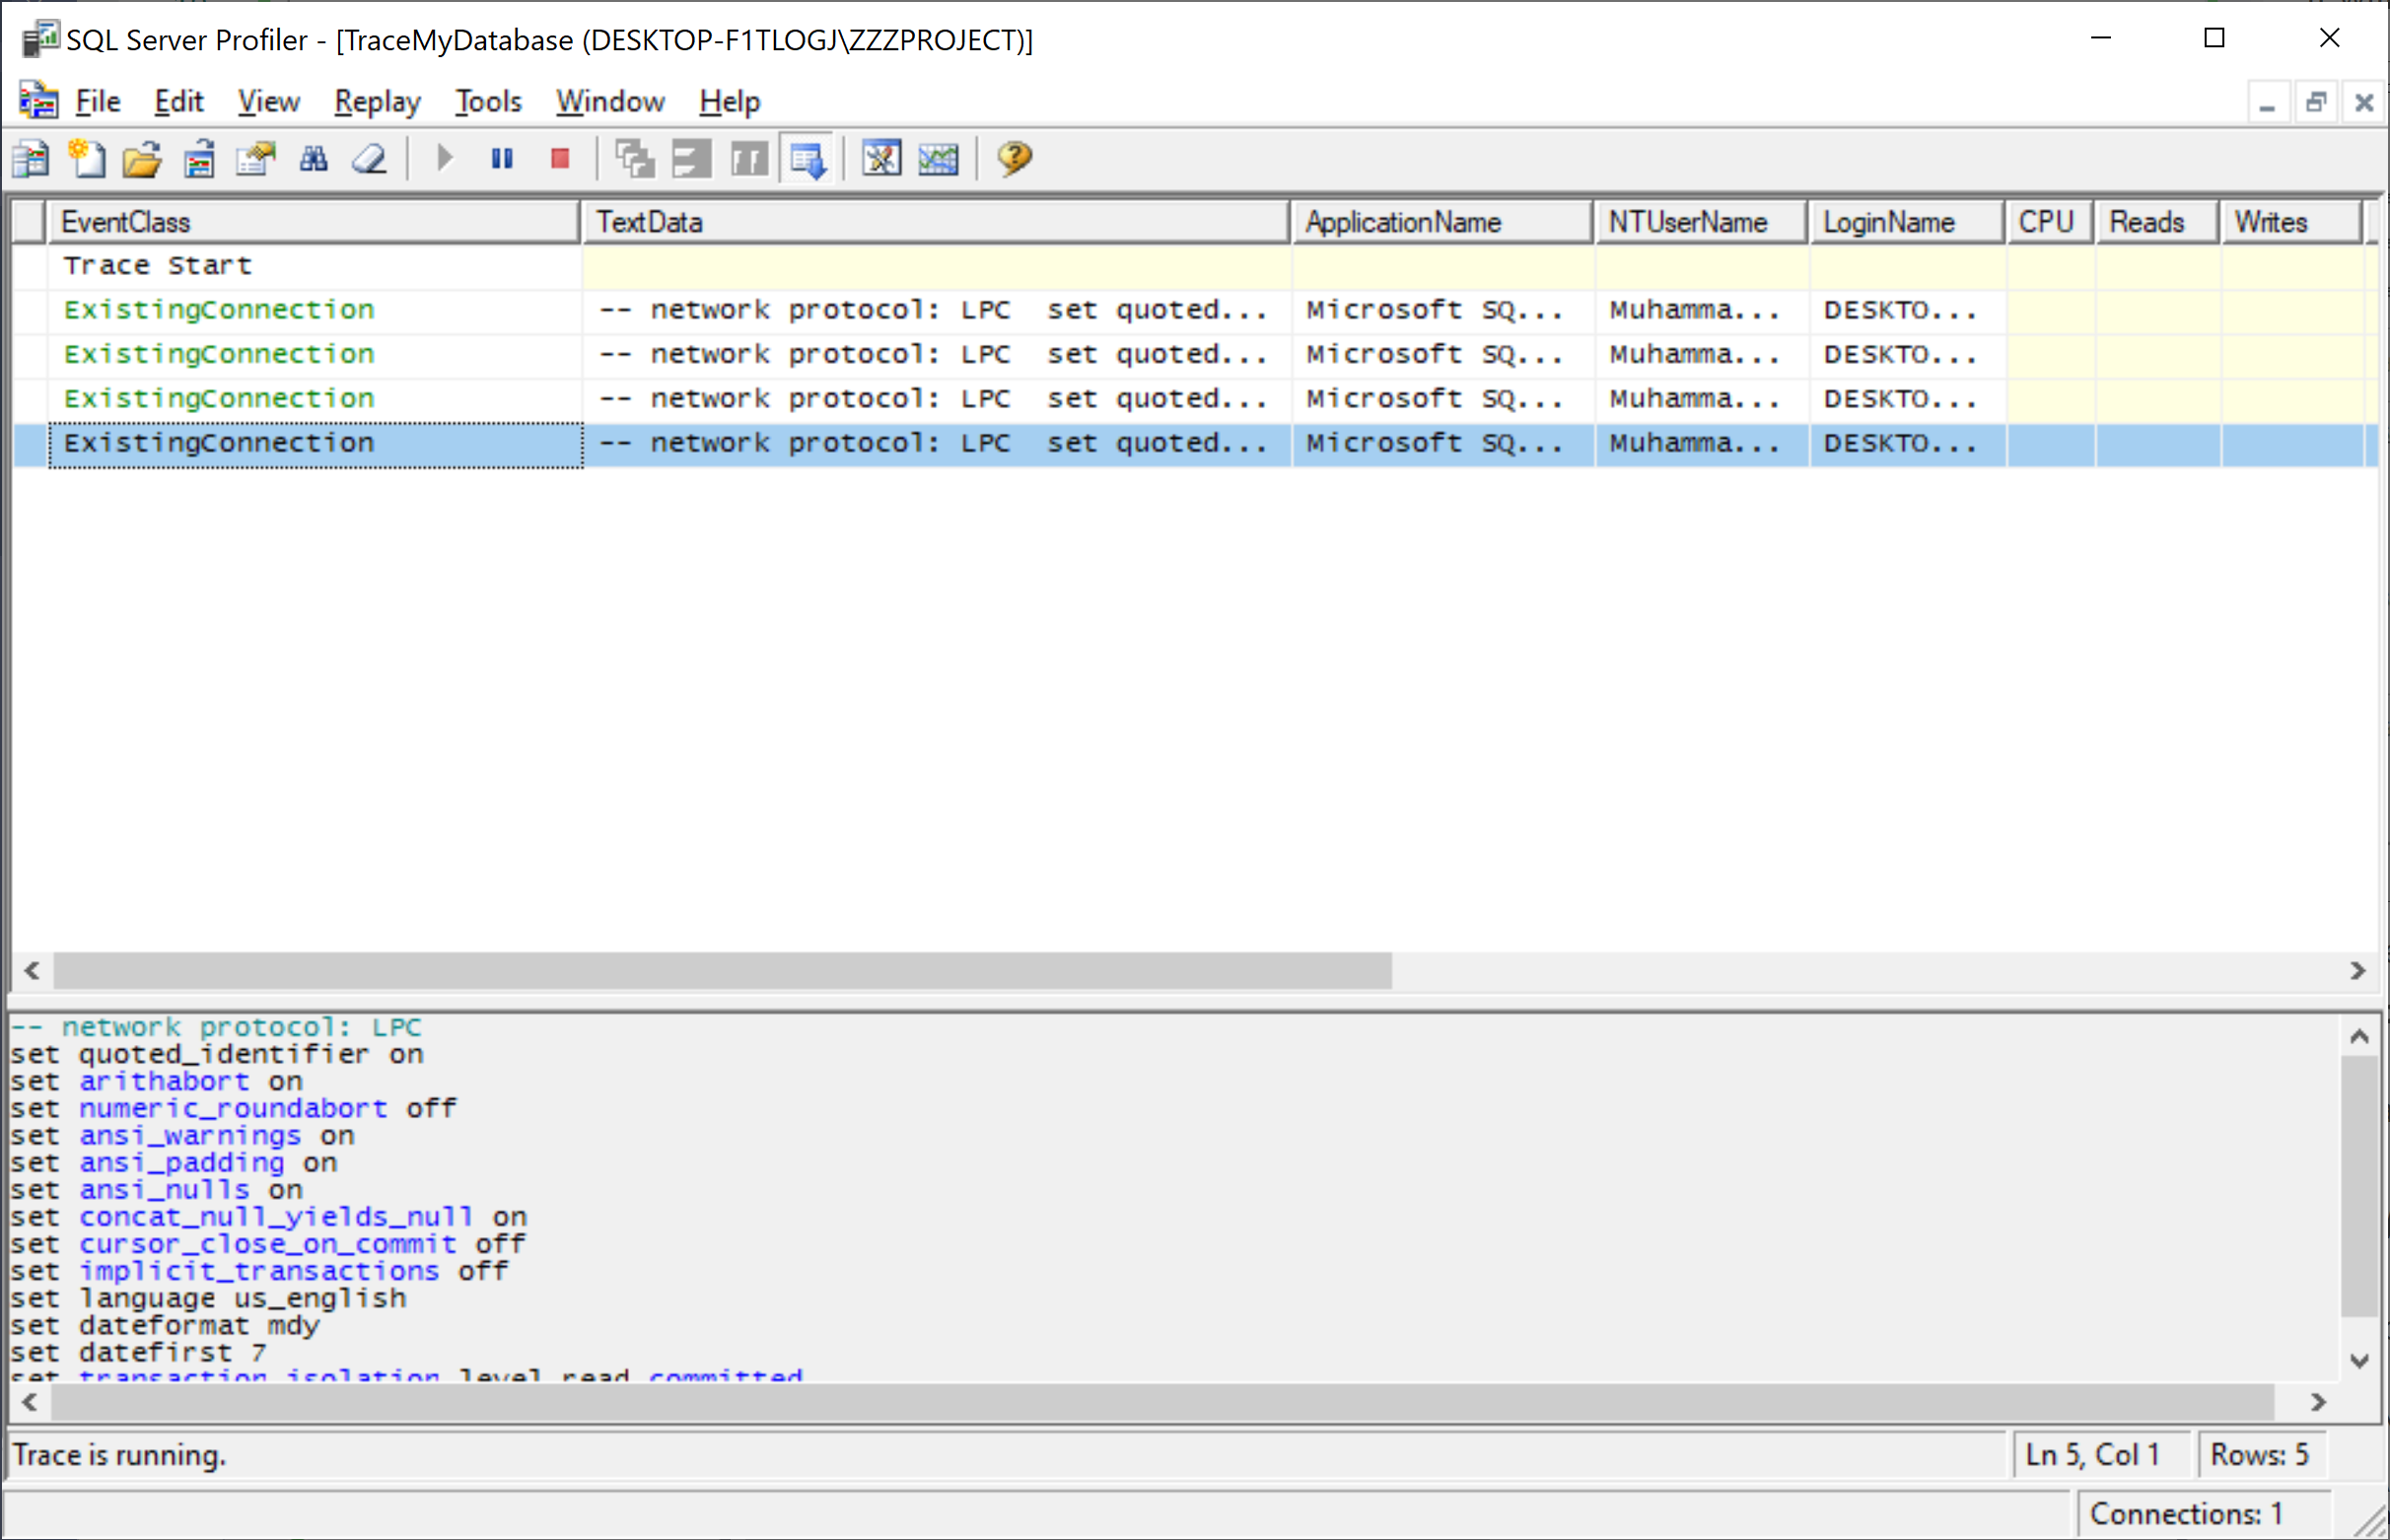
As you can see, tracing started. Let's open a query editor and execute a simple query.
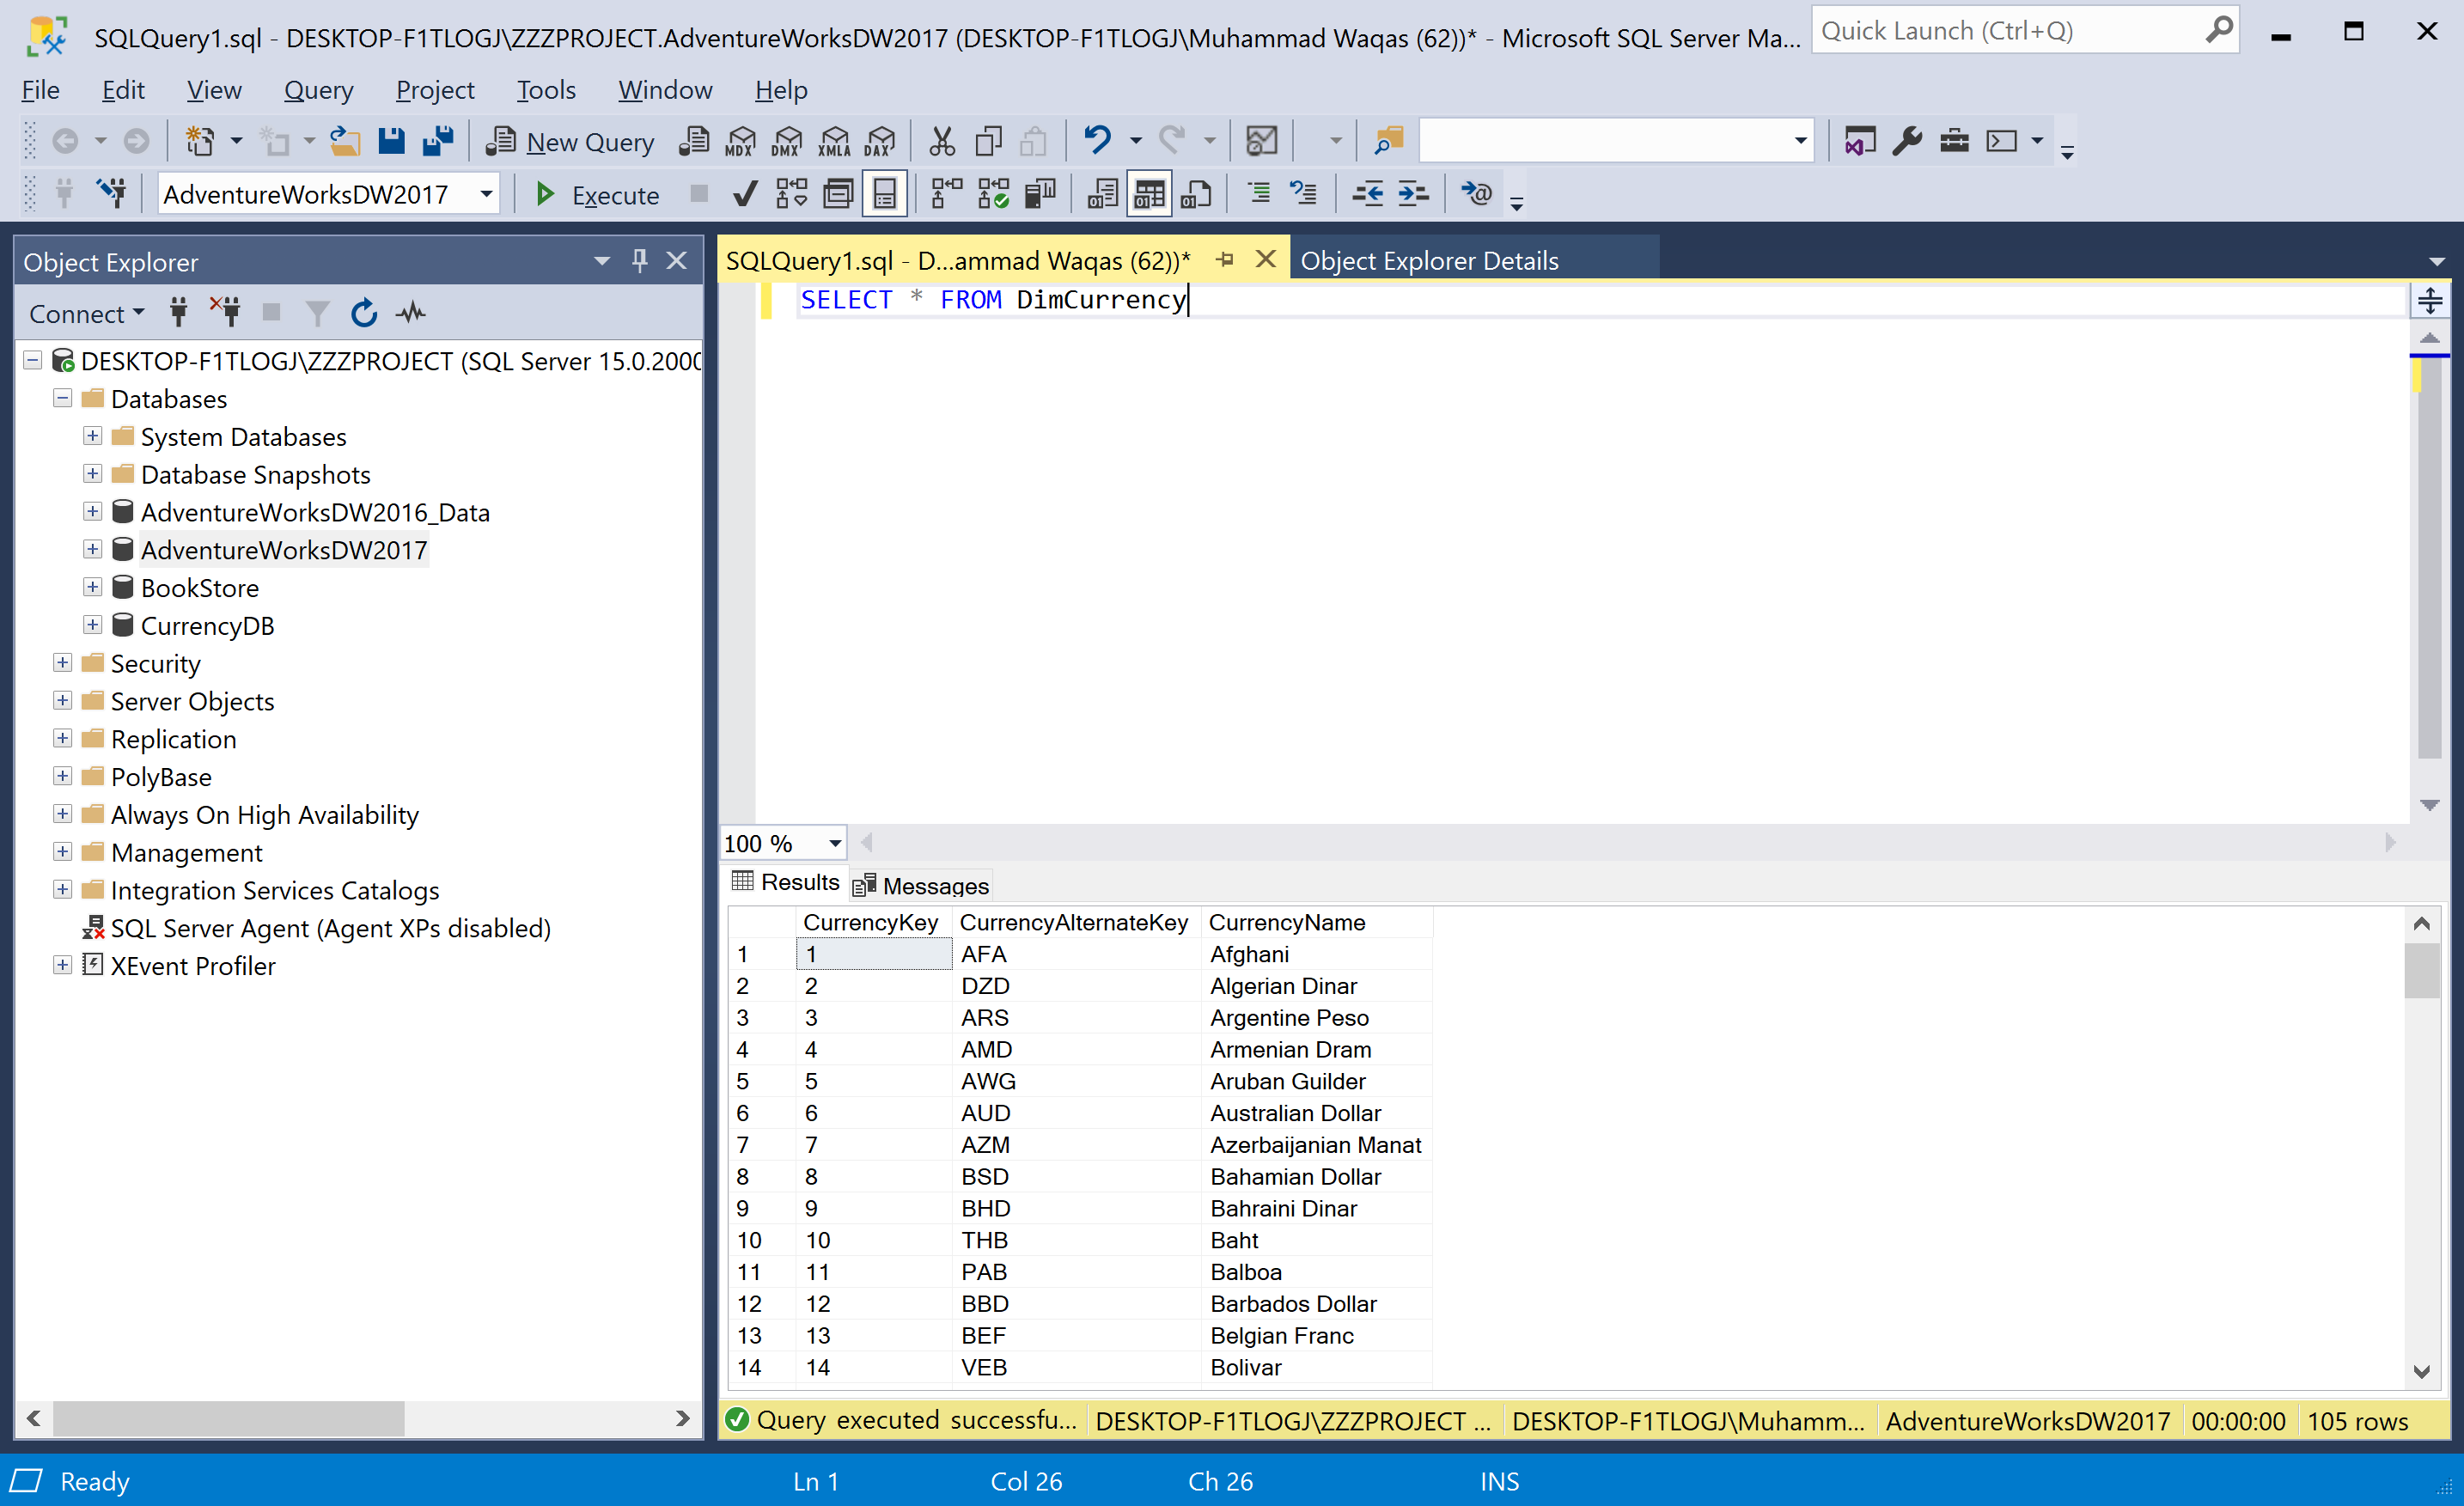
When you execute this simple query, go to the SQL Server Profiler, and you will see the query logs.
