Visual Studio Debugging in Visual Studio
In Visual Studio, you debug an app using the Visual Studio debugger which helps you observe the run-time behavior of your program and find problems.
What is Debugging?
The term debugging means removing bugs or errors from your code. Now, there are different ways to do this. For example;
- Debug by scanning your code looking for typos, or by using a code analyzer.
- Debug code by using a performance profiler.
- Debug by using a debugger.
What is Debugger?
A debugger is a very specialized developer tool that attaches to your running app and allows you to inspect your code. The Visual Studio debugger is a powerful and essential tool to find and fix bugs in your applications.
- In Visual Studio, when you debug your app, it usually means that you are running the application with the debugger attached.
- The debugger provides many ways to see what your code is doing while it runs.
- You can step through your code and look at the values stored in variables, you can set watches on variables to see when values change, you can examine the execution path of your code, etc.
How to Start the Debugger?
To debug, you need to start your app with the debugger attached to the application process. Now to examine your app code, you need to stop the execution and then see what is going on there.
Breakpoints
Breakpoints are a useful feature when you know the line of code or the section of code that you want to examine in detail. A breakpoint indicates where Visual Studio should suspend your running code so you can take a look at the values of variables, or the behavior of memory, or whether a branch of code is getting run.
If you have a file open in the code editor, you can set a breakpoint by clicking in the margin to the left of a line of code.
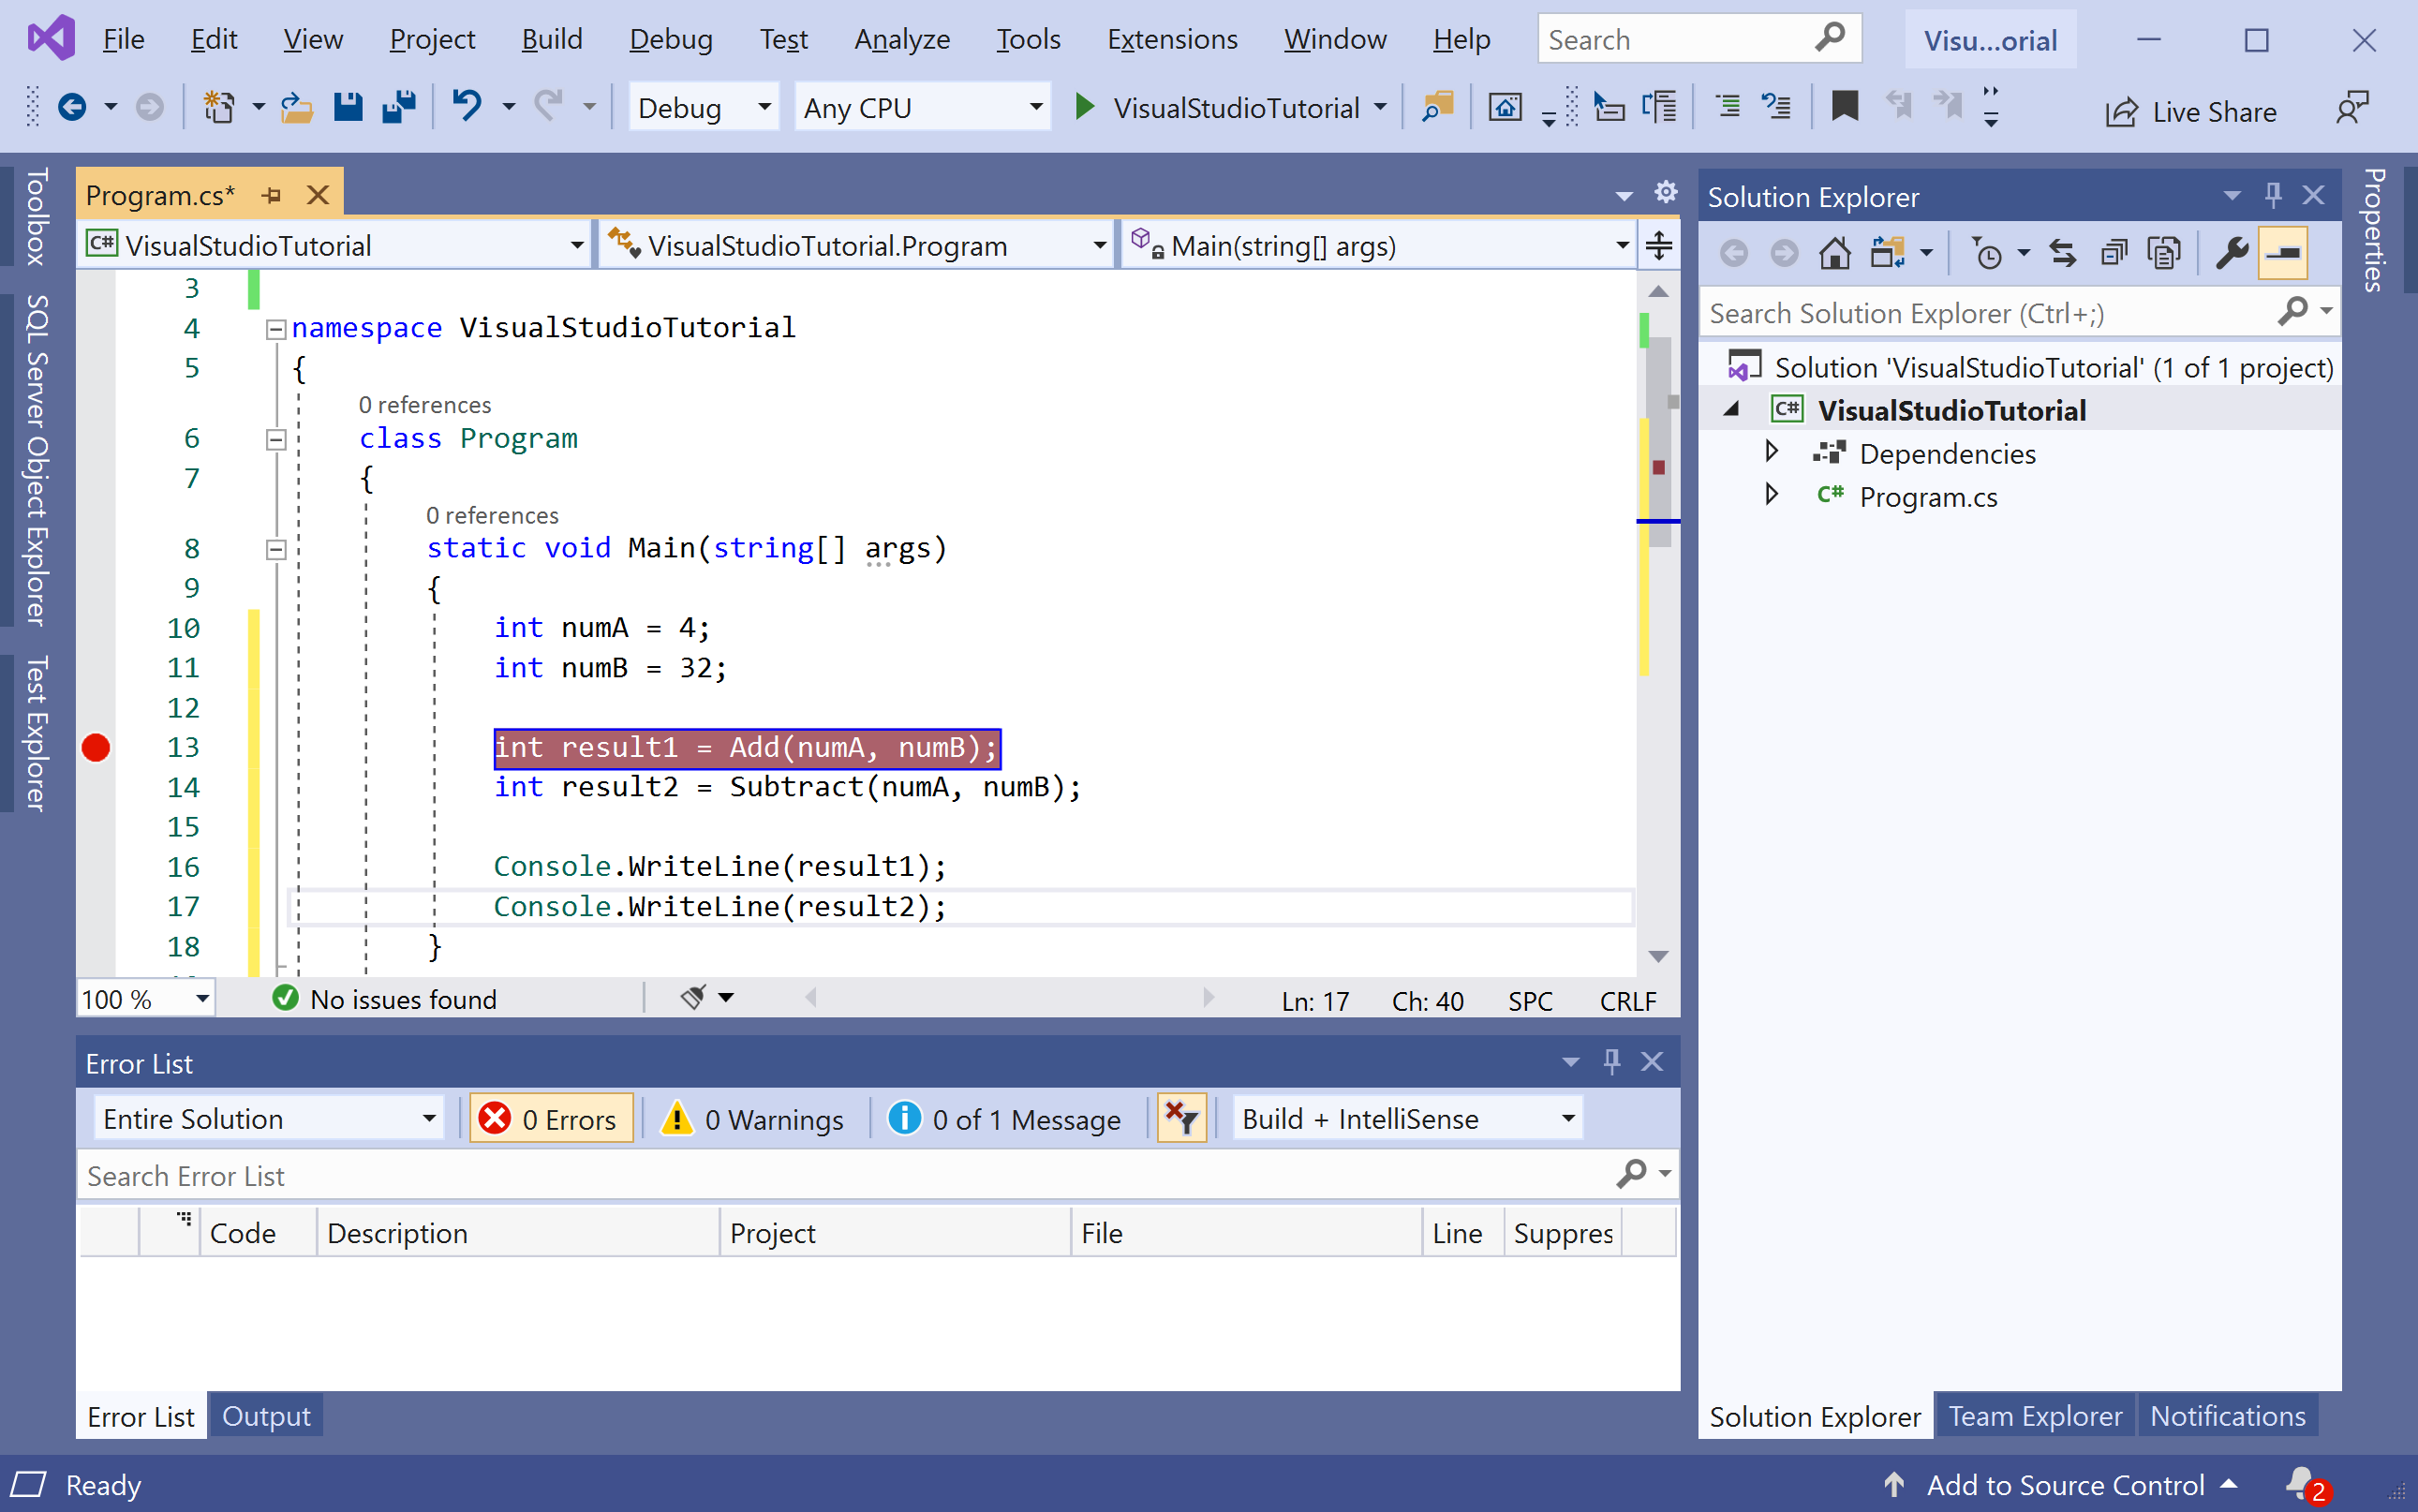
Press the F5 button or use the Debug > Start Debugging menu option, or you can also press the green arrow button in the toolbar. It starts the debugger and stops at the first breakpoint.

The yellow arrow represents the statement on which the debugger paused, which also suspends app execution at the same point, you can now check the values of each variable just by hovering the mouse cursor on that variable and it will display its =s value.
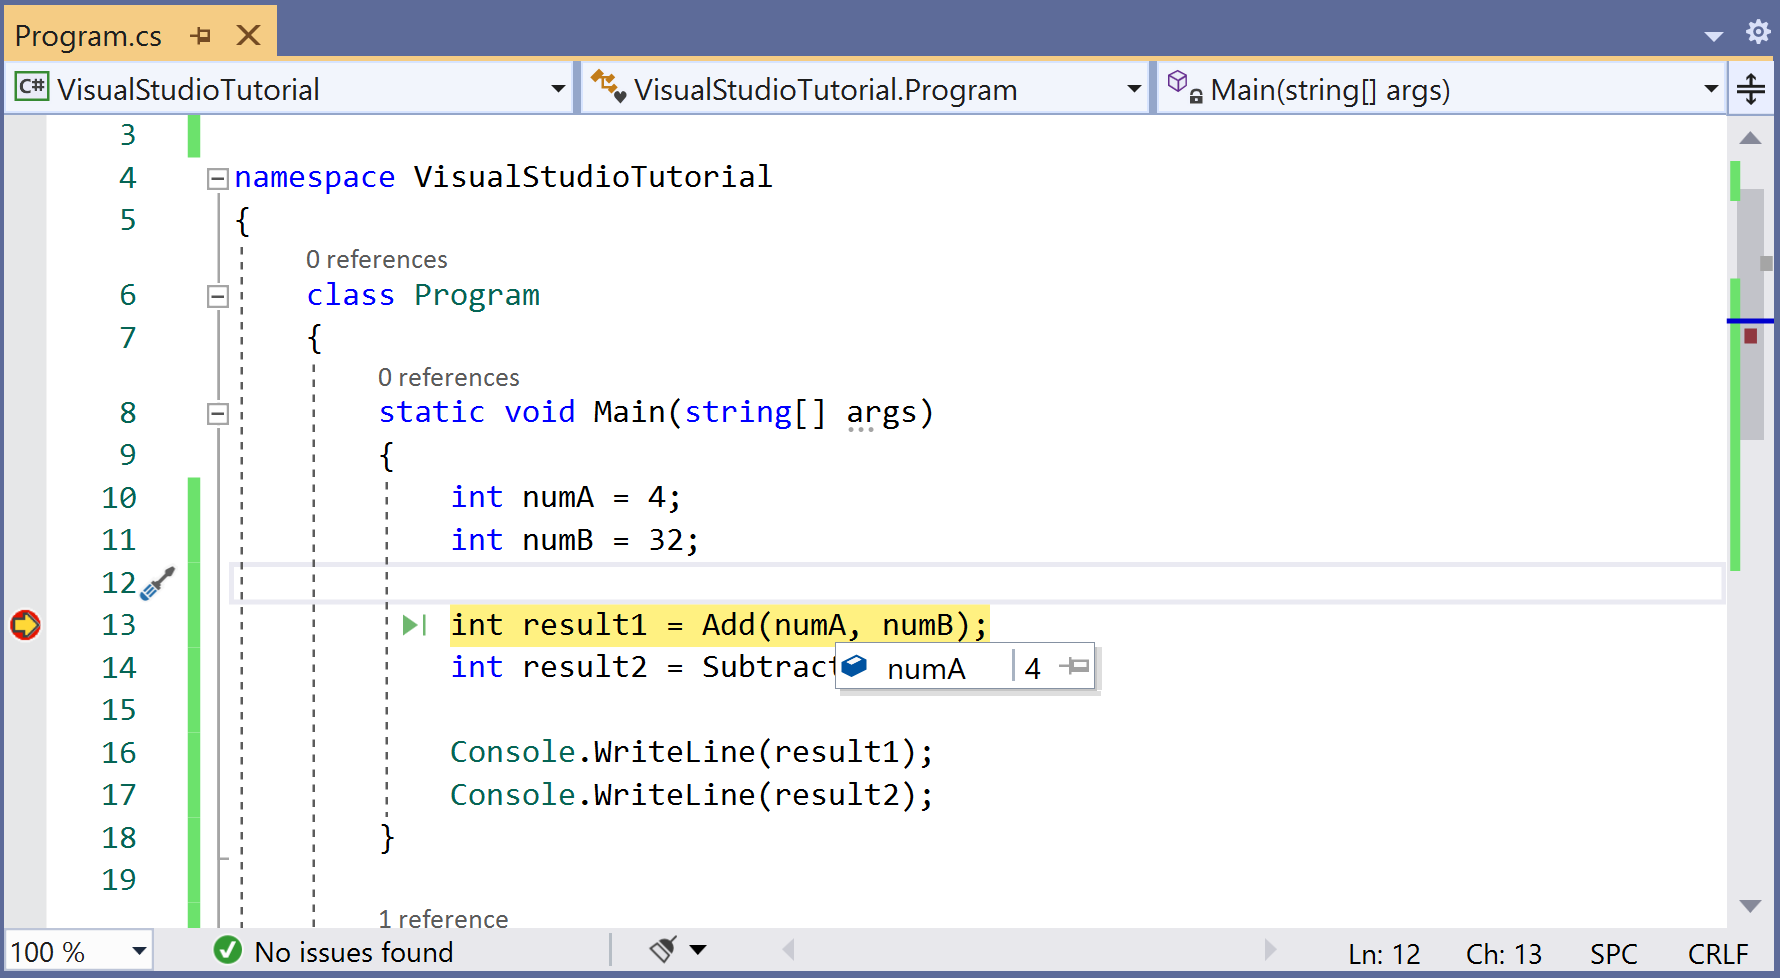
The line with the Add() method call hasn't yet been executed. Now there are two ways, you can either go inside the Add() method and see line by line execution of the code or you can skip that and just move to the next line which is called the Subtract() method.
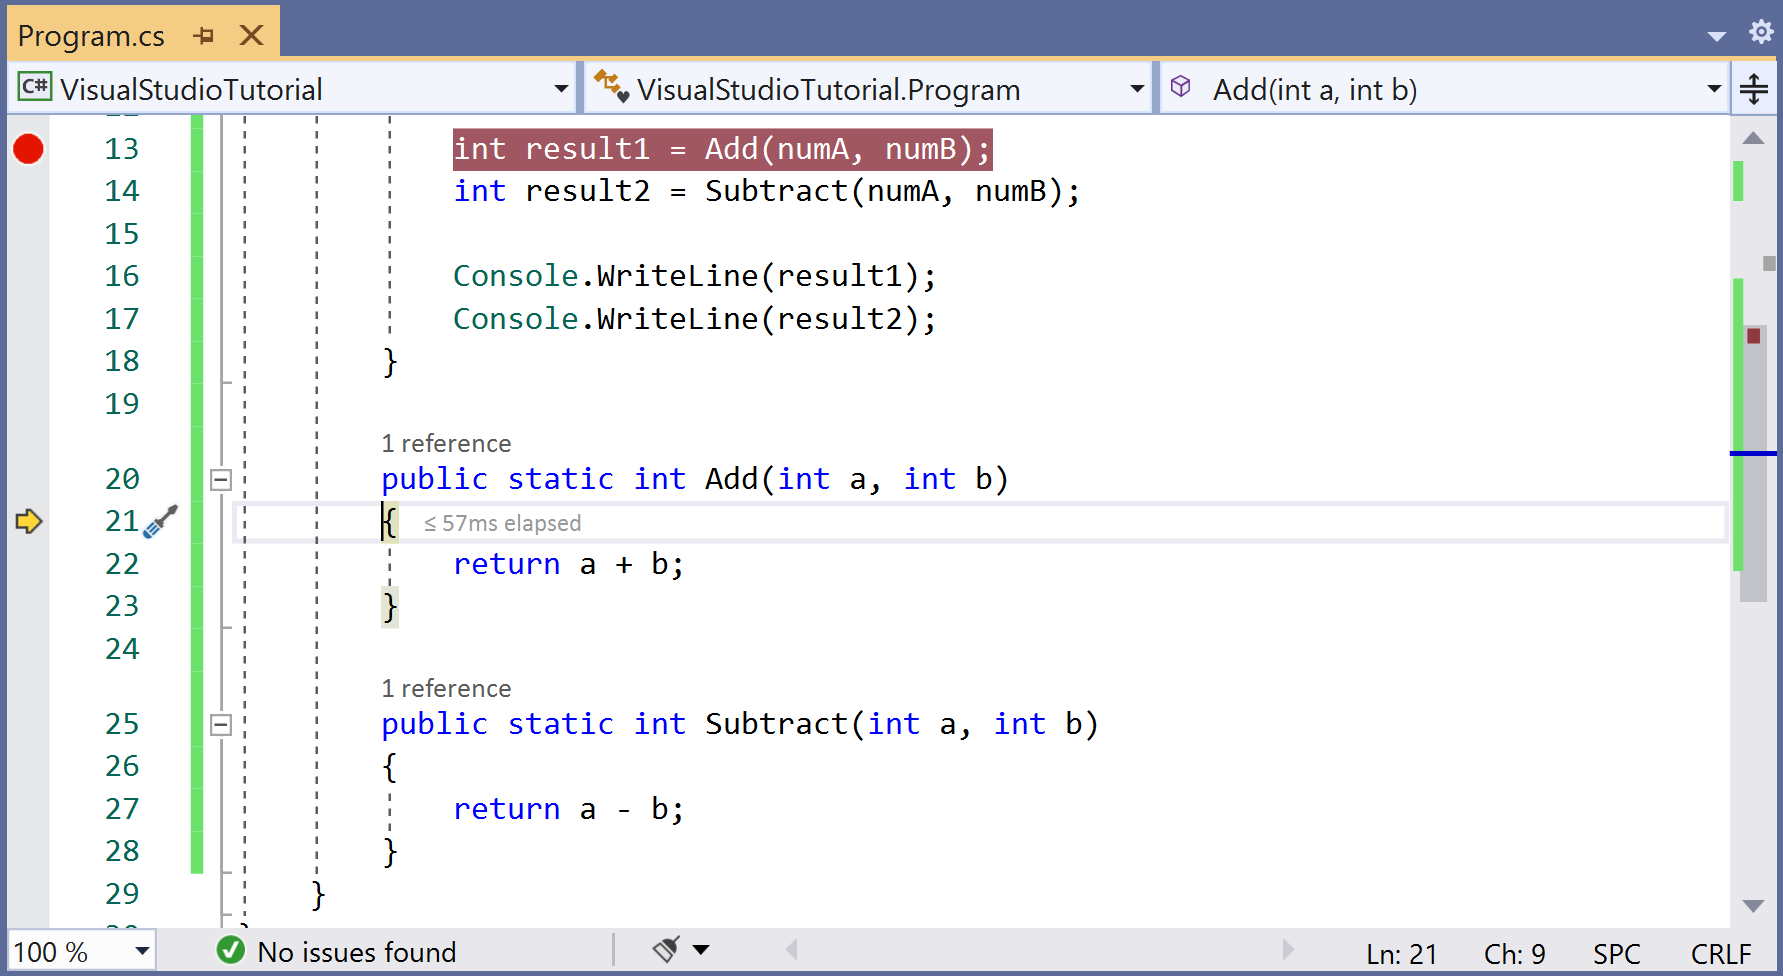
If you need to go inside the Add() method, press F11 and you will see the yellow arrow inside the Add() method.

Now press the F10 and you will see the line by line execution of the code. If the method body ends and you press again the F10 button then you will see that it will return to Main where the Add() method has been called.
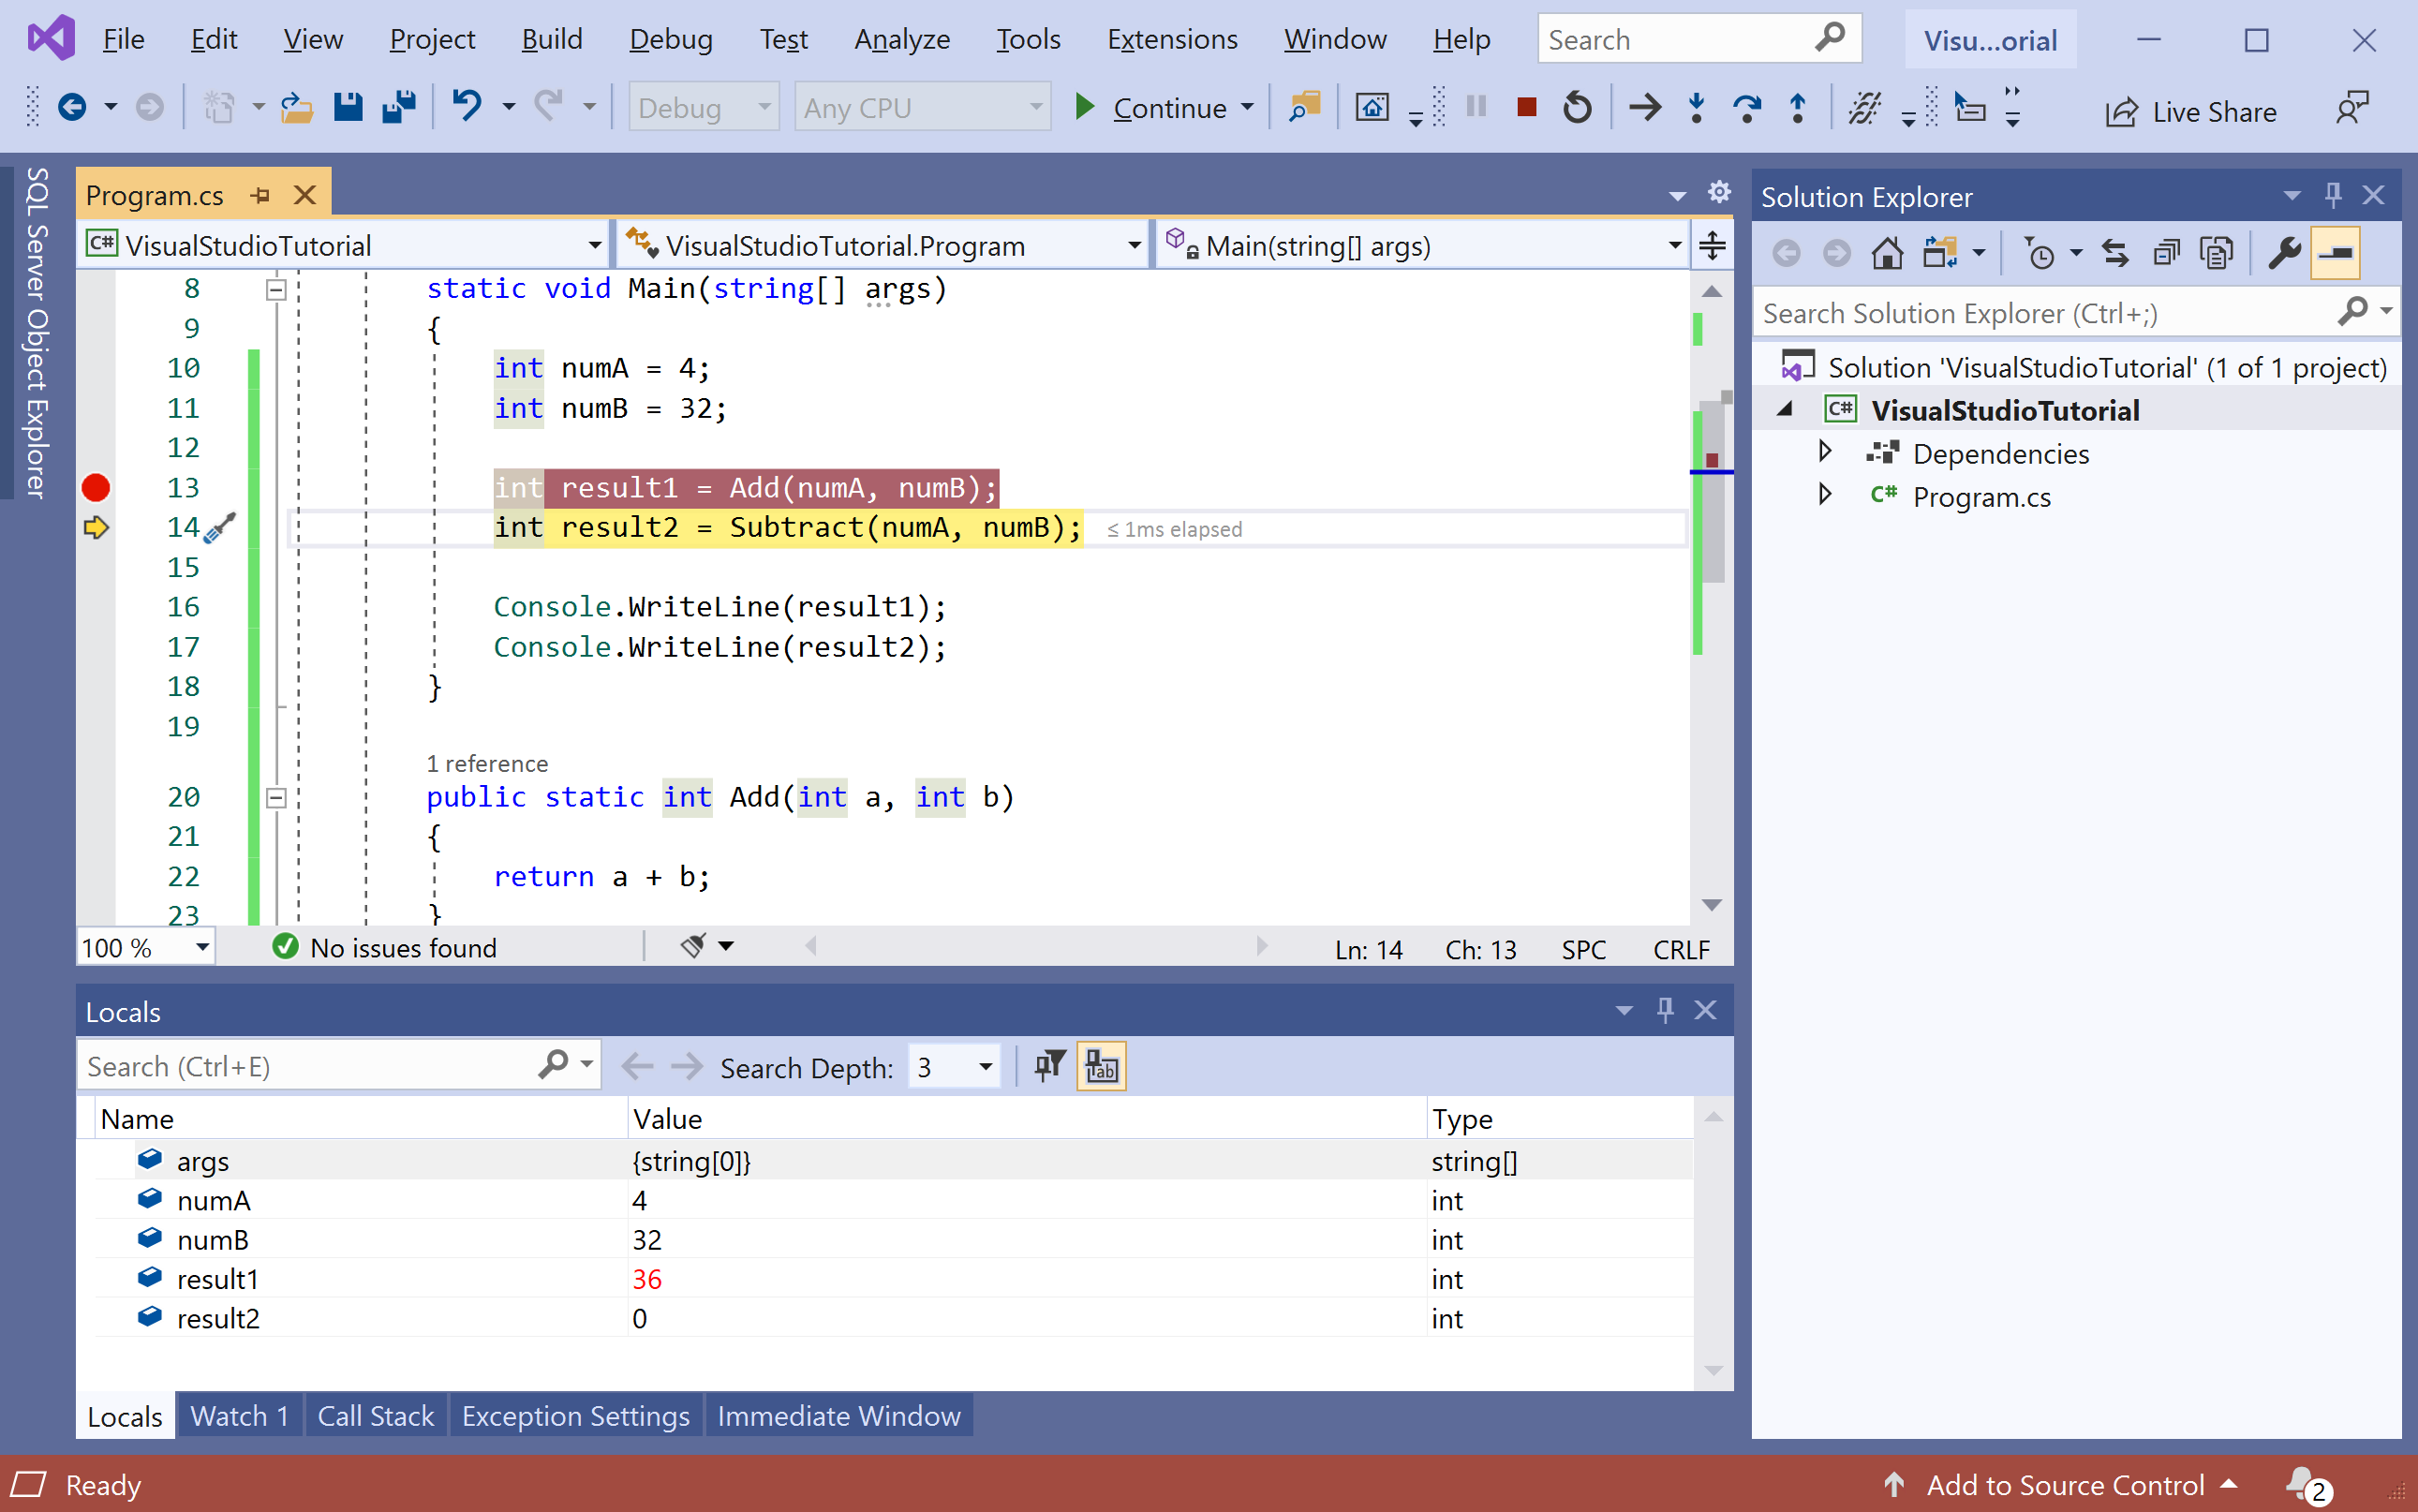
Locals Window
The Locals window shows you the variables that are currently in scope.
Autos Window
In the Autos window, you see variables along with their current values and their types. The Autos window shows all variables used on the current line or the preceding line.
Watch Window
You can use a Watch window to specify a variable (or an expression) that you want to keep an eye on. While debugging, right-click an object or variable and choose Add Watch.

For more information about the debugging in Visual Studio, visit the official documentation page https://docs.microsoft.com/en-us/visualstudio/debugger/
